🔬 BINA 2024 Community Congress, Sept 23-27 🦡
Register Today!Introduction | Metrology Suitcase Program | Resources |
Metrology is defined by the International Bureau of Weights and Measures (BIPM) as “the science of measurement, embracing both experimental and theoretical determinations at any level of uncertainty in any field of science and technology.” (Brown, 2021) It focuses on developing new measurement units, measurement unit systems, and methods, as well as the creation and maintenance of measurement standards and their transfer to users.
Metrology facilitates data integrity and accuracy by identifying measurement uncertainty and by providing confidence in the data collected with the system. As such, a quality management system will monitor the trend in the performance metrics of an instrument and will help determine when a re-calibration of the system is needed.
Control, control, and control again…
Unless you plan to be the only one acquiring your image data (here we assume more than one image is needed) on the same day, in a very short period, on the same instrument, and in the same environmental and ambient conditions, chances are you will introduce non-biological variables into your dataset related to the image acquisition, in addition to the variables introduced at the sample preparation level. Have you thought of including control experiments to consider these variations?
Studies have shown that more than 70% of researchers who tried to repeat another scientist’s experiments failed, while more than 50% failed to reproduce even their own experiments (Baker, 2016). One factor behind the reproducibility crisis of experiments published in scientific journals is the frequent underreporting of imaging methods caused by a lack of awareness and/or a lack of knowledge of the applied technique (MarquĂ©s et al., 2020; Sheen et al 2019).
Another important contributor to the reproducibility crisis is the absence of quality controls (QCs) performed on the instrument that was used to collect the data presented. While QC procedures for some methods used in biomedical research, such as genomics (e.g., DNA sequencing, RNA-seq), have been introduced and implemented (e.g. ENCODE), this is not the case for optical microscopy instrumentation and image data. While calibration standards and protocols have been published, there is a need to increase awareness and agreement on common standards and guidelines for quality assessment in light microscopy (Nat Methods 2018,15,395).
The absence of quality controls from your imaging systems can lead to erroneous interpretation of your image data and scientific claims that no one will be able to reproduce. Is this a biological effect or a bias introduced by the imaging systems? By using control experiments specifically designed to measure the performance of your imaging system, you can discern real biology from artifacts. These control experiments may include measures of the illumination power and uniformity, the sensor sensitivity, and/or the optical lateral and axial resolution. If multiple channels (colors), multiple fields of view, or a time series are involved, measures of the system chromatic aberration and co-registration as well as the stage focus and precision can be included (Nelson, G. et al. 2021). These control experiments measuring the quality and performance of your imaging system can be used to identify changes over time (trend) and aging or malfunction of the component of your imaging system. They can also be used to compare different imaging systems’ performance. More importantly, they can be used to identify batch effects in your image dataset or correct such effects using normalization or recalibration in specific instances (Nelson, G. et al. 2021; Faklaris et al. 2022).
Guidelines are still emerging to define and standardize how to measure the performance of your imaging systems, which tools to use, and at which frequency these measures should be performed. Below is a non-exhaustive list of several tools and resources are being developed to help bioimaging scientists improve the quality and management of their image data
See Resources
Be a part of the growing community that is performing quality controls and standardizations of their instruments
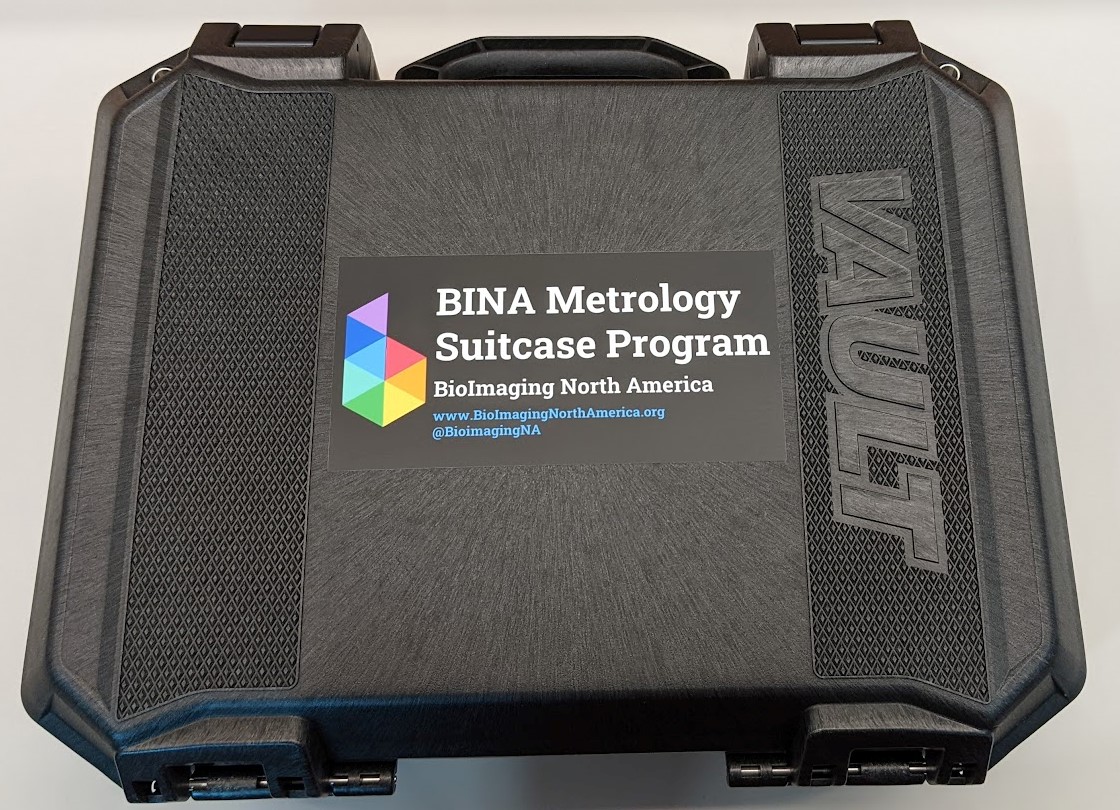
BINA’s Quality Control and Data Management Working Group (QCDM WG) leads the BINA Metrology Suitcase program, inspired by a similar initiative from the French Network for Multidimensional Optical Fluorescence Microscopy (RTmfm) along with members of France BioImaging (Faklaris et al. 2022).
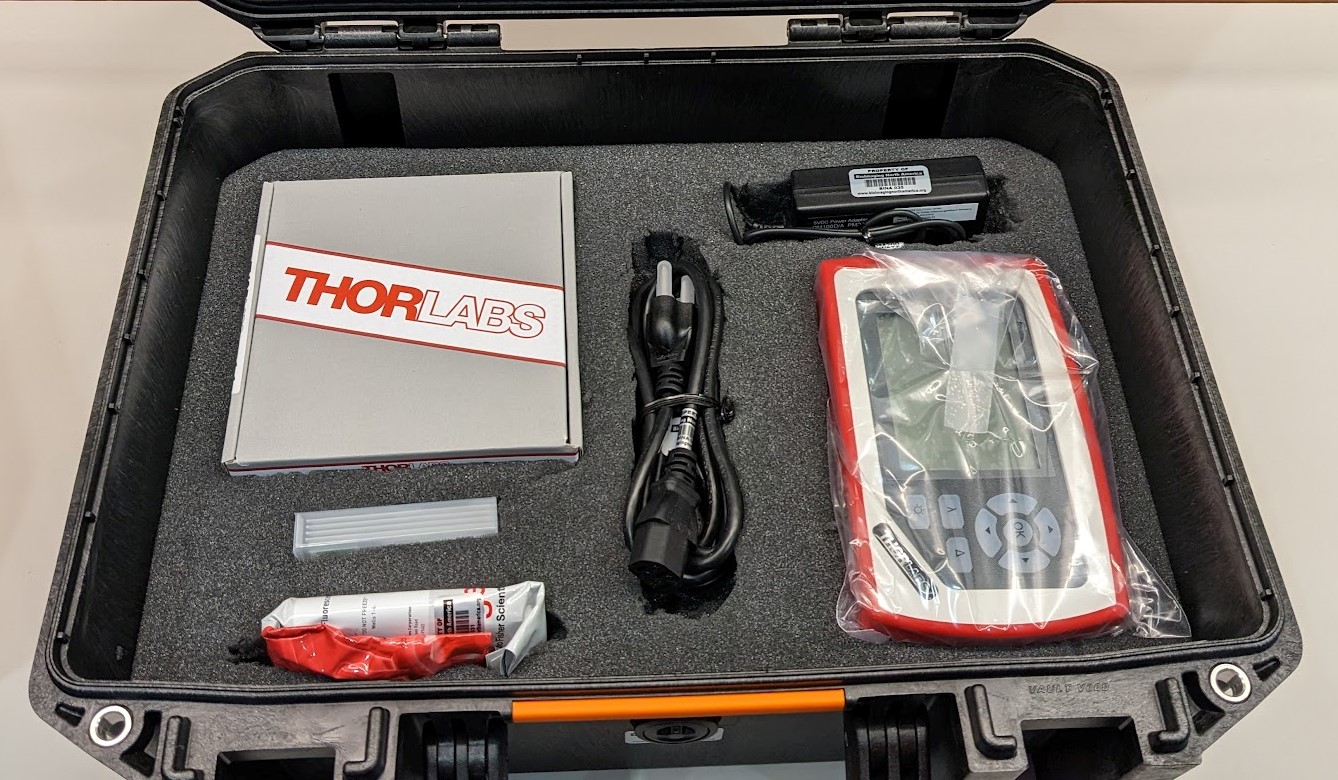
The protective hard shell case contains
All nestled in protective foam padding to protect it during shipping.
BINA’s Metrology suitcase initial pilot program provides a small, hard shell case containing tools and resources needed to conduct light source intensity/stability measurements and point spread function monitoring on light microscopy instruments.
The case and its components were first distributed in test facilities within the BINA community (1 in Canada, 1 in Mexico, and 4 across the US distributed between the east (2) and west coasts and central US) to ensure the instructions and protocols were clear, and that we were providing users with a realistic indication of the time commitment needed.
We have learned from this first phase and are now improving our documentation and expectations. Stay tuned, for a report on lessons learned from the Pilot Phase of the Metrology Suitcase Program.
Contact BINA (contact@bioimagingna.org) to request the suitcase and start learning and experimenting with metrology, and we’ll connect you with your local suitcase ambassador.
If you own a power meter, beads and slides TRY THE TWO PROTOCOLS BELOW:
We invite you to contact us if there is a resource not listed here that you have found useful and would like to suggest adding (contact@bioimagingna.org)
If you are a Core Facility located in Canada, Mexico or the United States of America, and would like to be included in the Core Facilities listed on the BINA website please sign up below.
Add Your Facility