Image Contest 2023
We are so thankful for all our 2023 Image Contest Contributors!!!
The Top 3 Images are:
- It takes two to Tanglow – Derrick Kamp
- Neuronal forest – Marko Pende
- Young mouse sagittal unstained section – Michael Shribak
Core Facility with the most users entering the contest: MDIBL Light Microscopy Facility
Honorable Mentions: (alpha. order)
- Tick – José Manuel Martínez López
- Squid creatures – Marko Pende
- Young kelp blades – Nat Prunet
- Leaf Walker – Hannah Somers

It Takes Two to Tanglow – Derrick Kamp

Neuronal forest – Marko Pende
Young mouse sagittal unstained section – Michael Shribak

Tick – José Manuel Martínez López

Squid creatures – Marko Pende

Young kelp blades – Nat Prunet

Leaf Walker – Hannah Somers

2001, A Space Eyedyssy – Hannah Somers

Giant Tardigrade from Space – Hannah Somers

Fission yeast: monochrome – Yuan Ren
I’m not alone – José Manuel Martínez López
Lactic splash – José Manuel Martínez López
Luminous Cityscape A Neurological Night Odyssey – Frederic Bonnet

Neon Fly in the Machine – Frederic Bonnet

Peering into the Goblin’s Lair – Frederic Bonnet

Wall of lamps – Viraj Doddihal
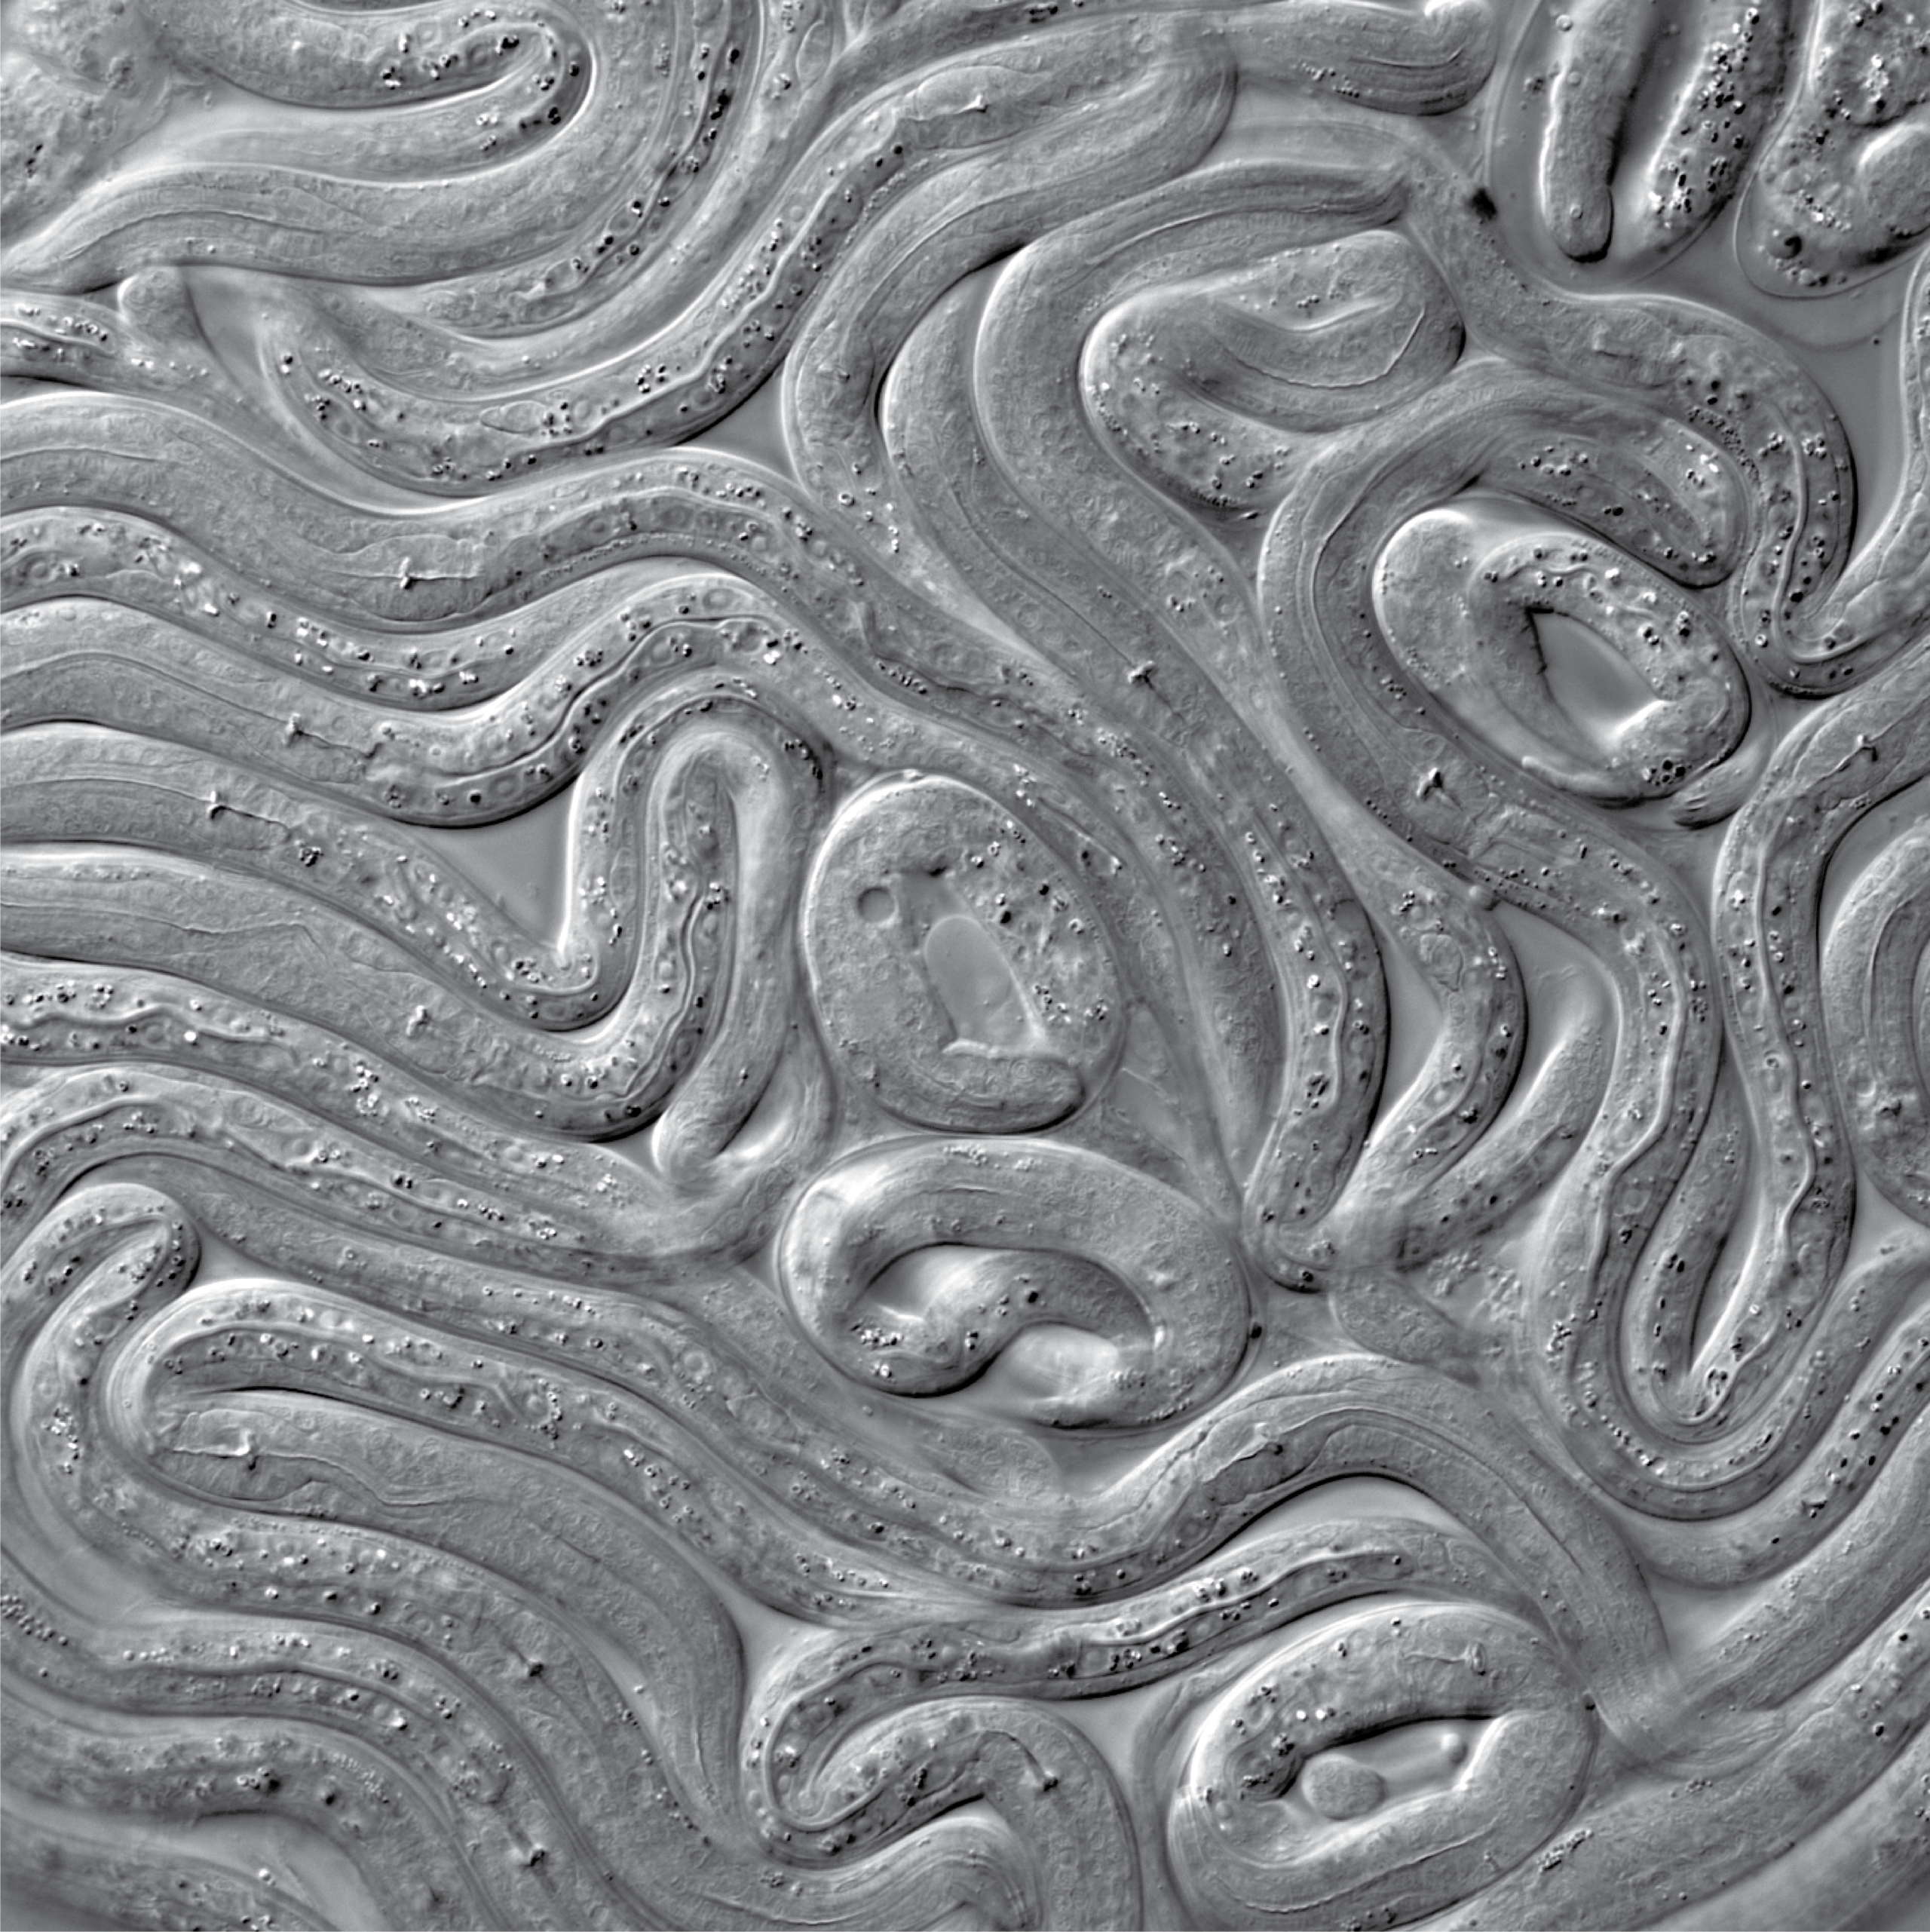
Oodles of worms – Philipp Dexheimer
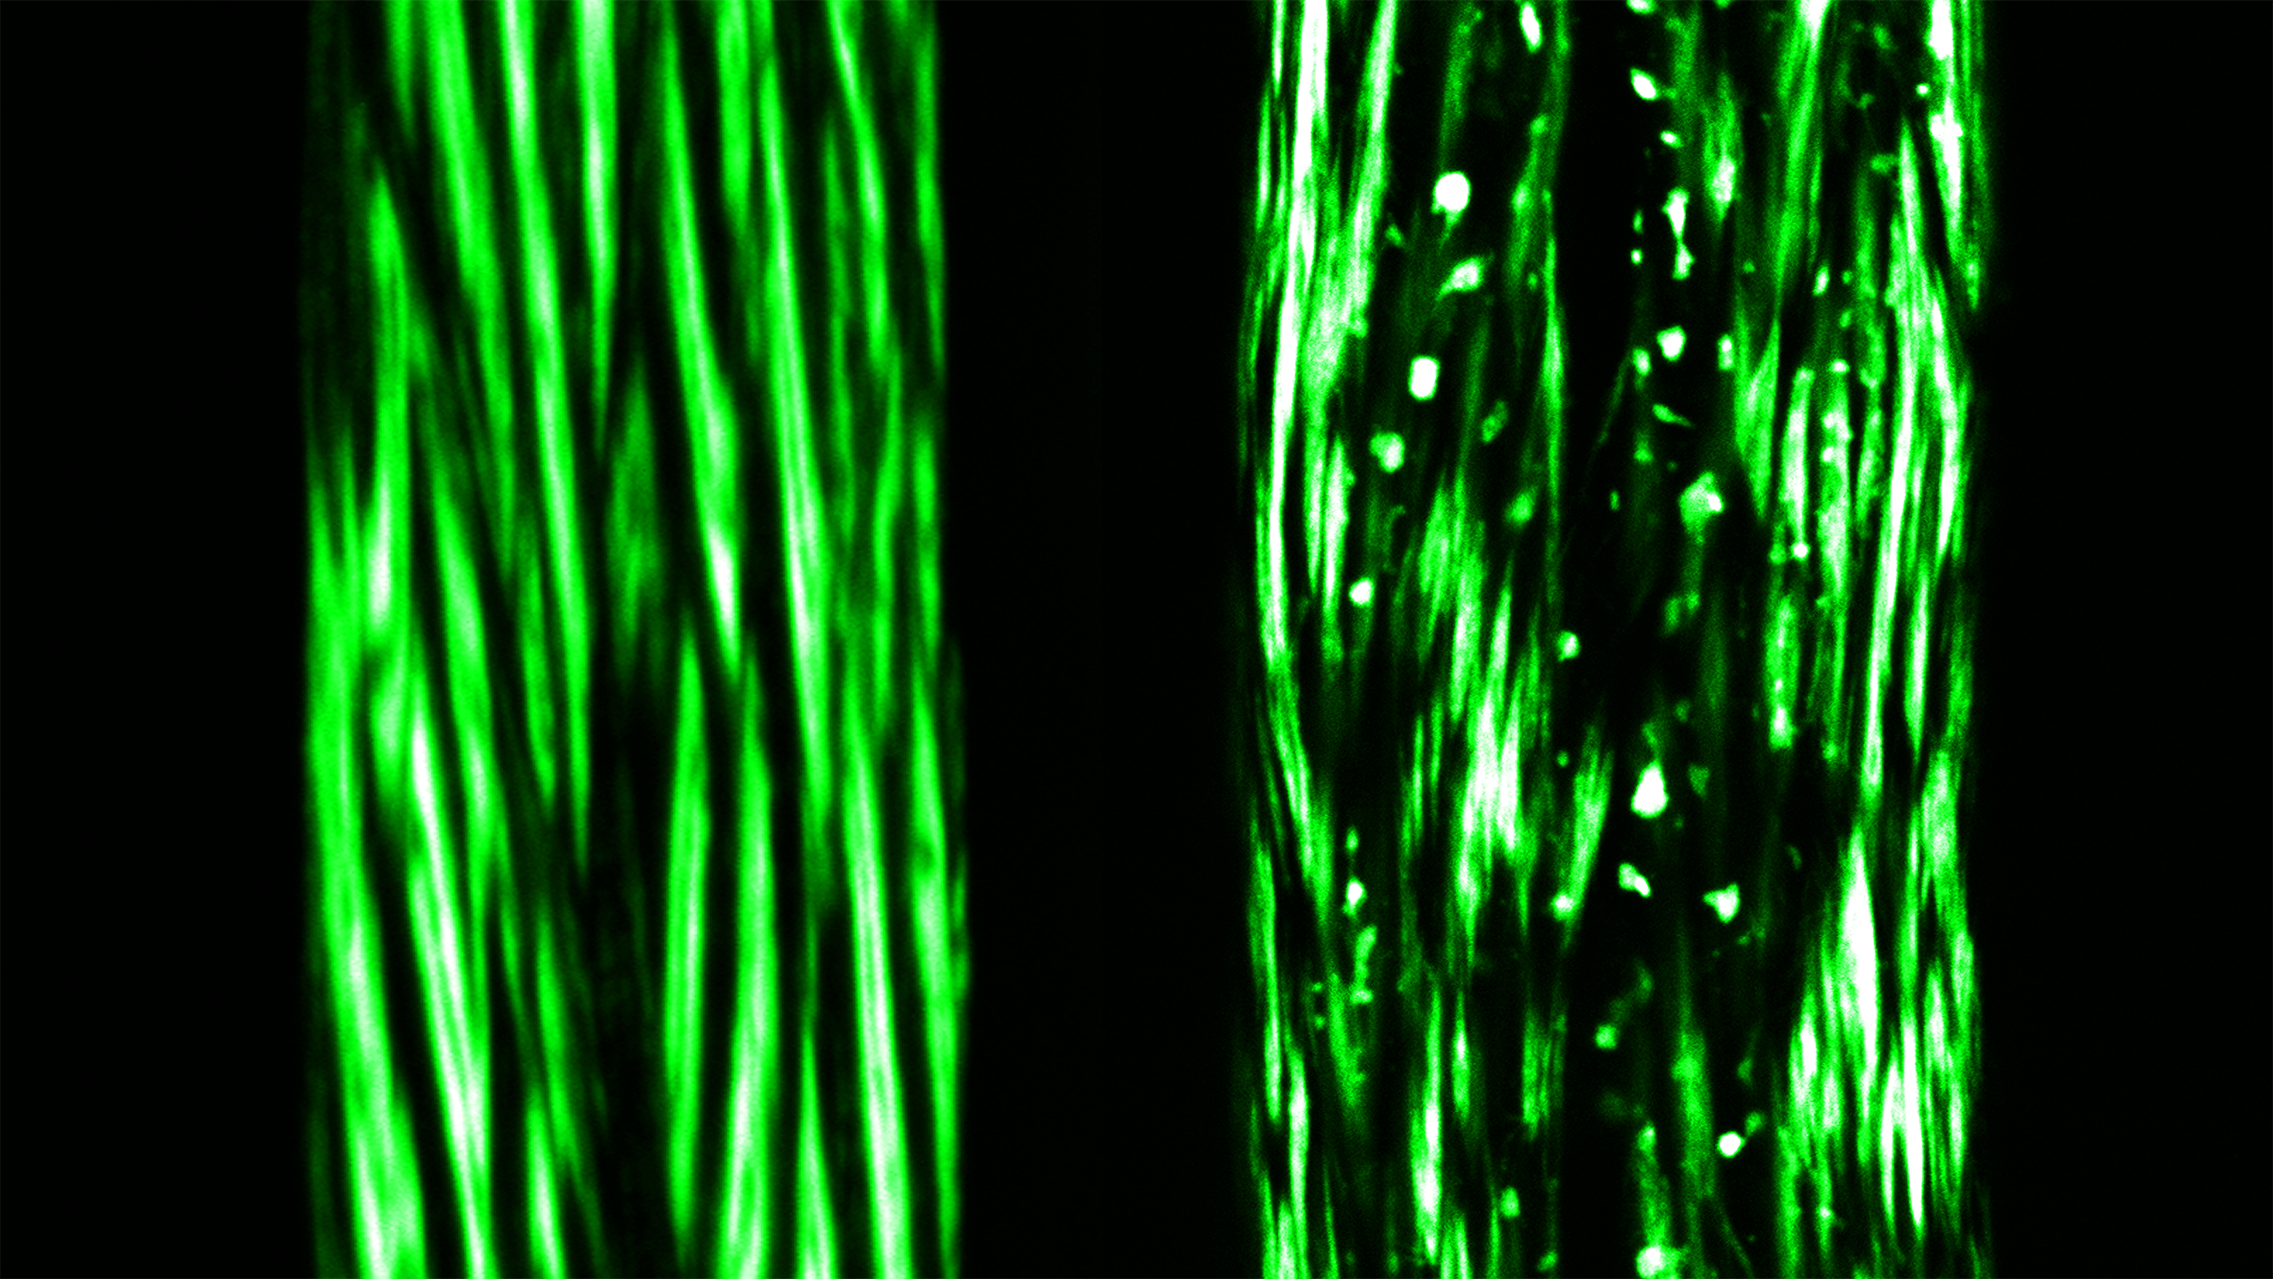
Comparing Healthy and Diseased Muscle Cells – Protein Aggregates at the Forefront – Philipp Dexheimer

Microscopic Metropolis – Philipp Dexheimer

Regenerated gill tissue in Atlantic salmon – Ensiyeh Ghanizadeh-Kazerouni (1)

Regenerated gill tissue in Atlantic salmon – Ensiyeh Ghanizadeh-Kazerouni (2)

Regenerated gill tissue in Atlantic salmon – Ensiyeh Ghanizadeh-Kazerouni (3)

The Heart hairs – Dina Hosseini Baygi

Green yarn – Dina Hosseini Baygi

Red Hair – Dina Hosseini Baygi

Lily pollen grain – Nat Prunet

strange fruits – Caramai Kamei

blowout – Caramai Kamei

galaxy – Caramai Kamei

Pink Plush: The intestinal cancerous stroma – Klea Nito
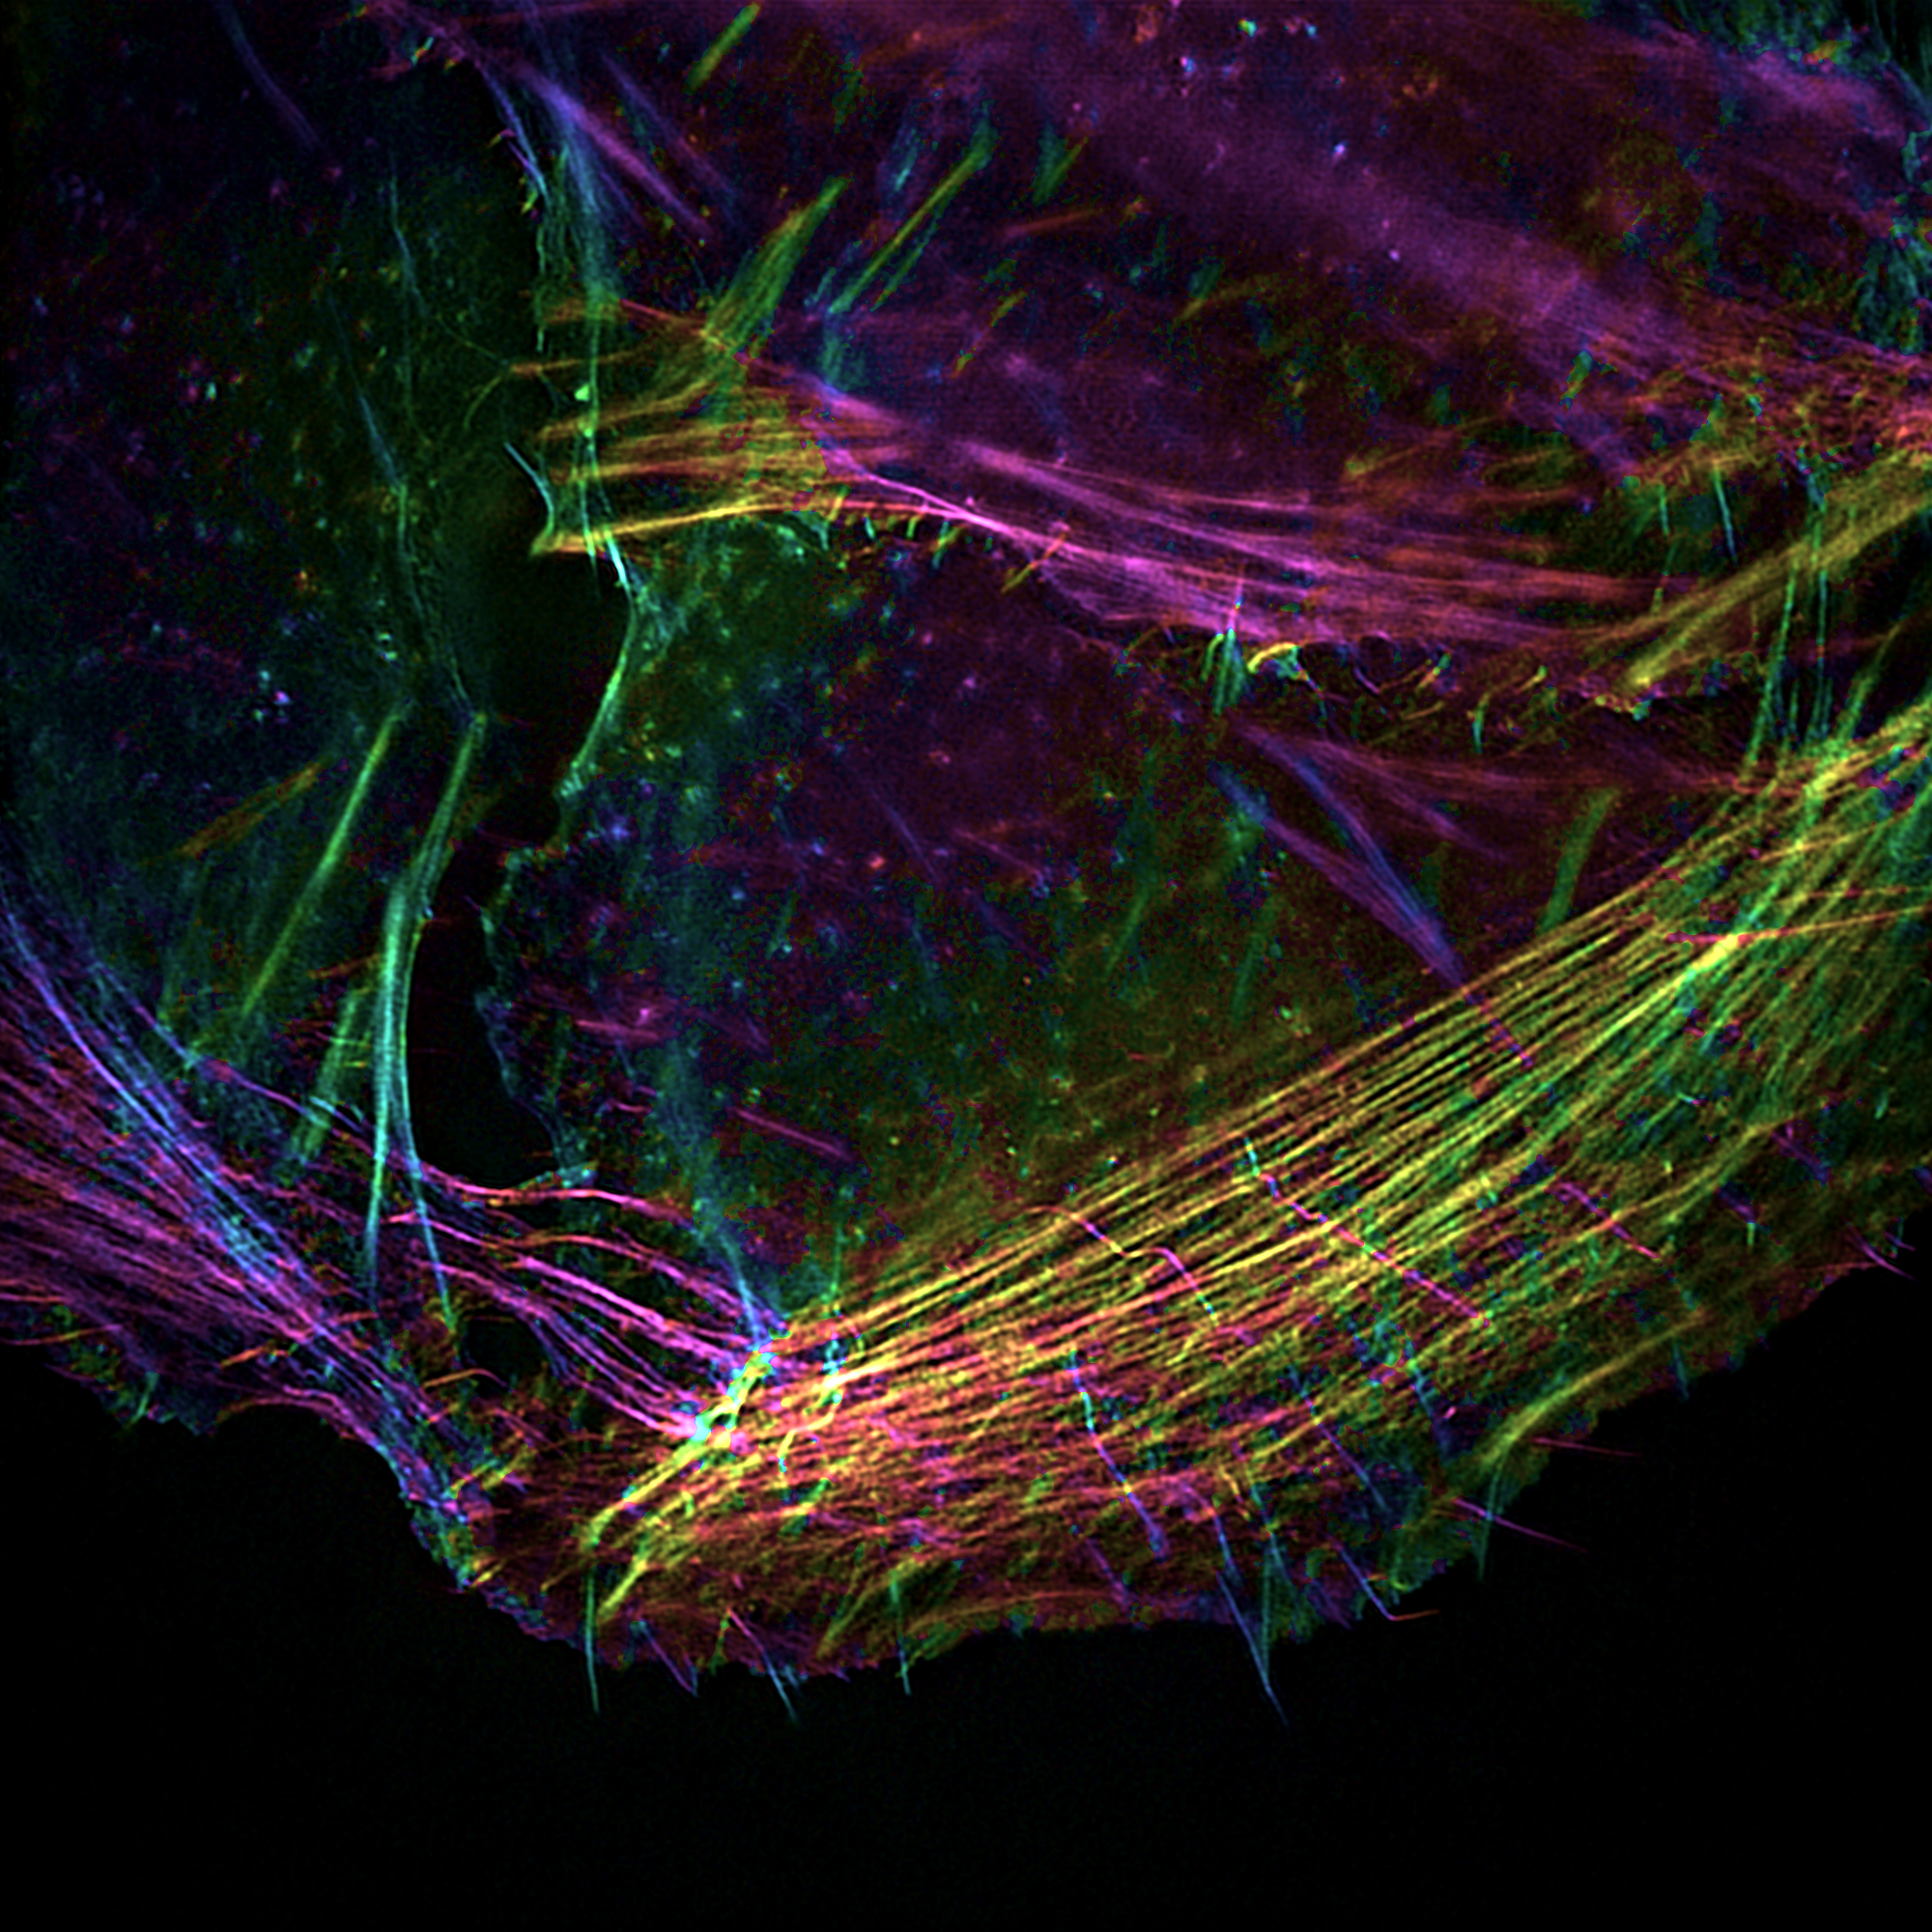
Fig1-2. Polar SIM imaging of Actin. Fig3. Tricolor imaging of Mitochondria Microfilament Microtubule. Fig4. Microtubule-mitochondrial bicolor imaging. – Airy Tech
Centrohelid heliozoan Raphidocystis – Vasily Zlatogursky
Centrohelid heliozoan Acanthocystis. – Vasily Zlatogursky

Cross section of a Fraser fir needle showing an abundance of poly phenolic cells (blue) induced through exogenous application of the defense phytohormone methyl jasmonate. Image was captureD using fluorescence lifetime imaging microscopy (FLIM). – Sai Karthik Gade

Bea[uterus] – Abby Bergman

N/A – Zachary
stellate trichomes of oak – Michael Shribak

diatom Actinoptychus – Michael Shribak

The Cytoskeleton of a Fibroblast and it’s Daughter – Daryan Chitsaz
Reflection Microscopy: Visualizing Reflective Brain Cell Membranes As They Grow – Daryan Chitsaz
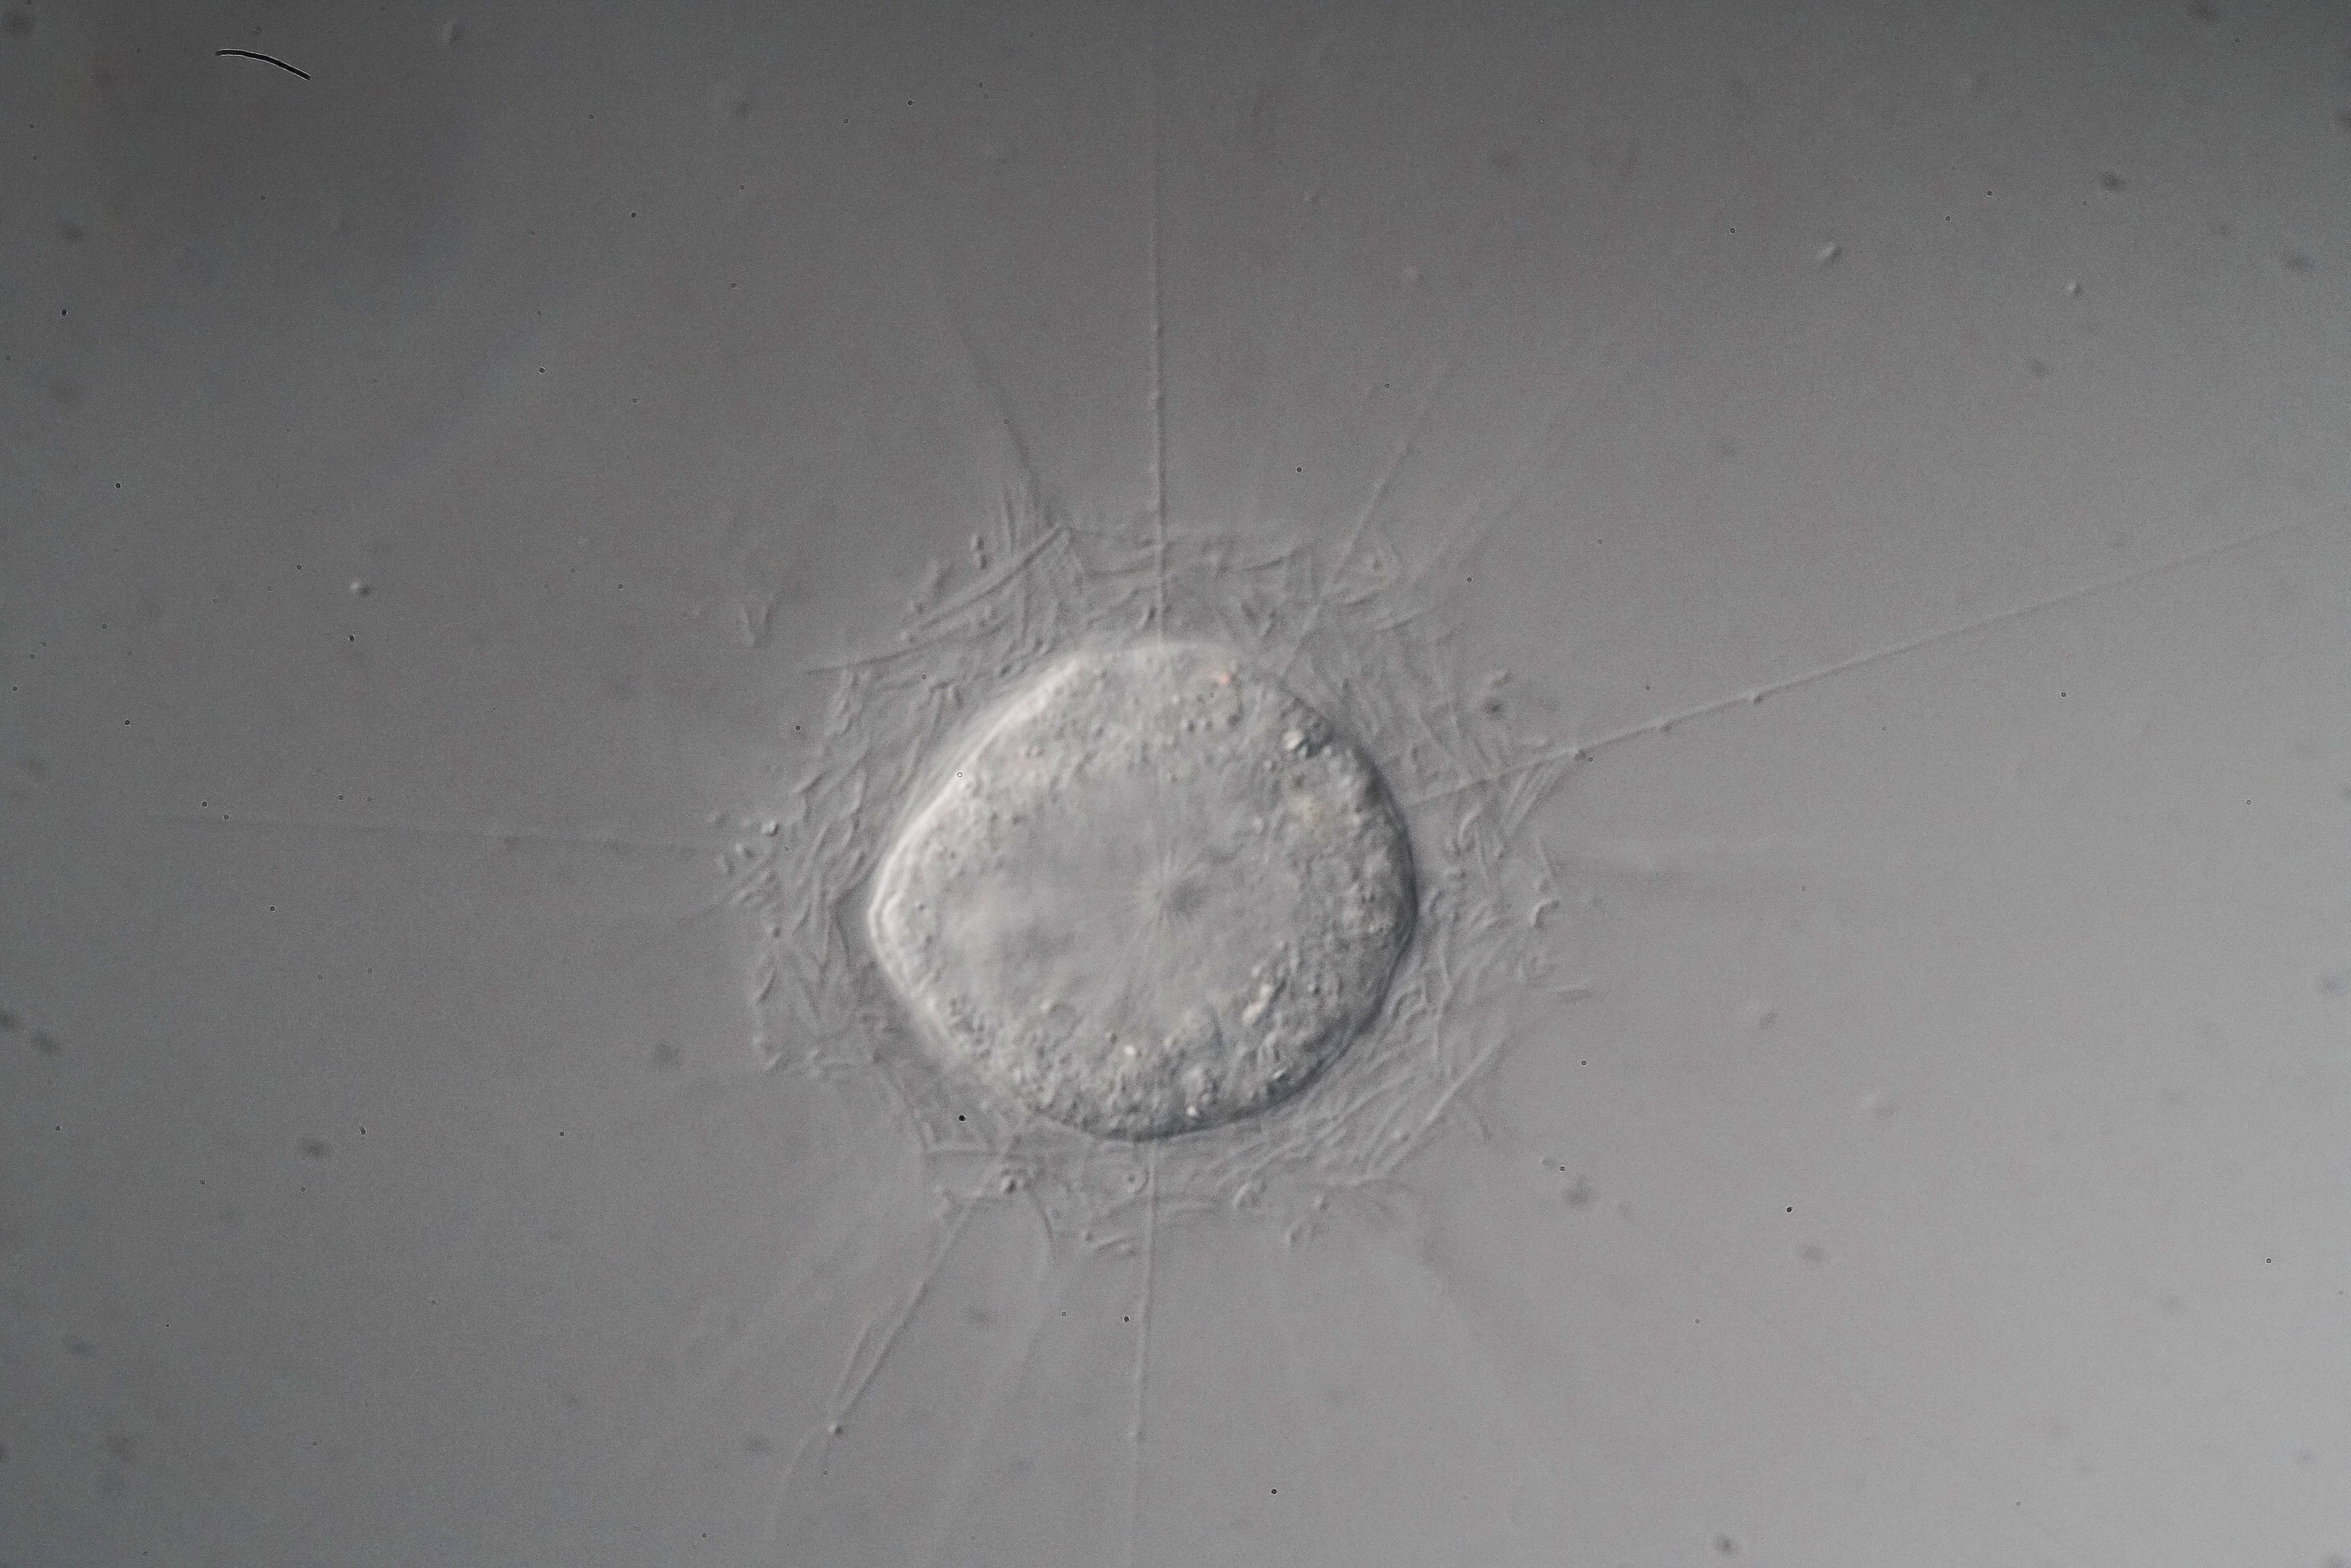
Fibronectin labeling in tissue-cleared 64-cell stage axolotl embryo – Samuel Broadbent

Hypoxia in mouse tumour – Faisal Rashed