Image Contest 2025- BINA 2025 Light Microscopy Image Contest
We are so thankful for all our 2025 Image Contest Contributors!!!
The Top three images are:
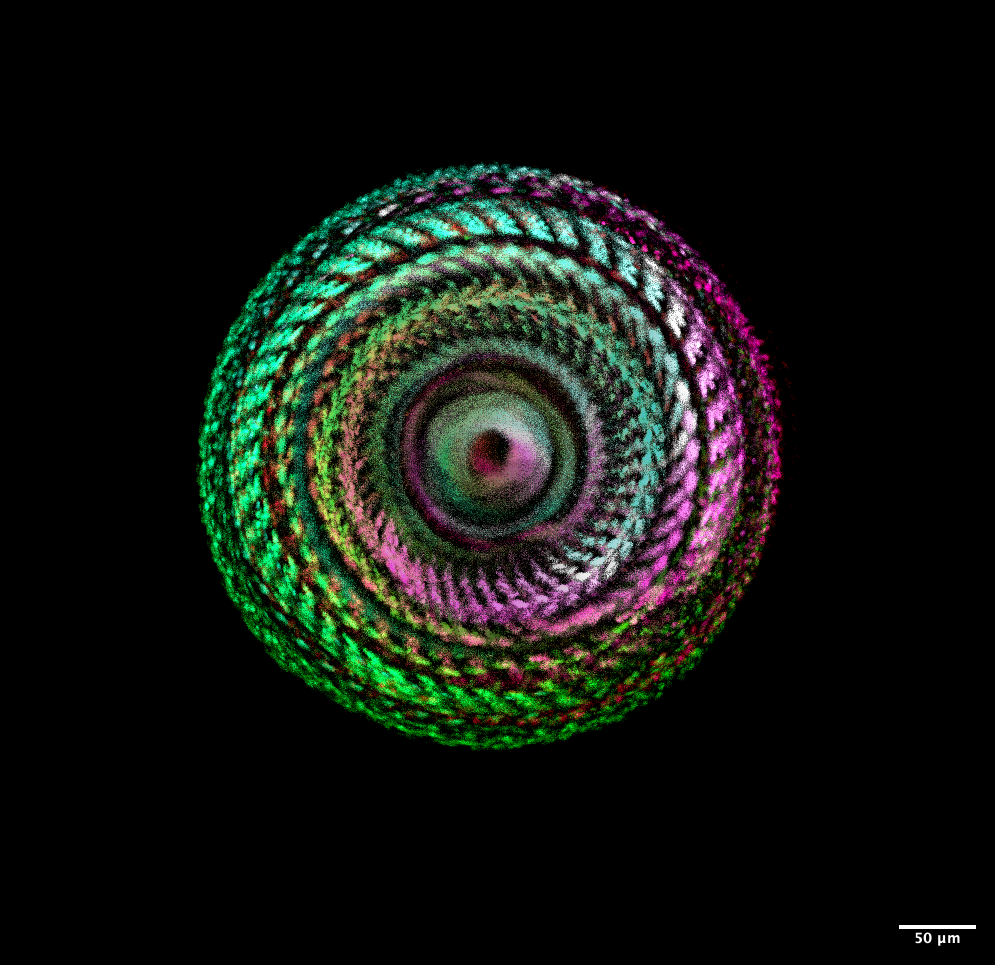
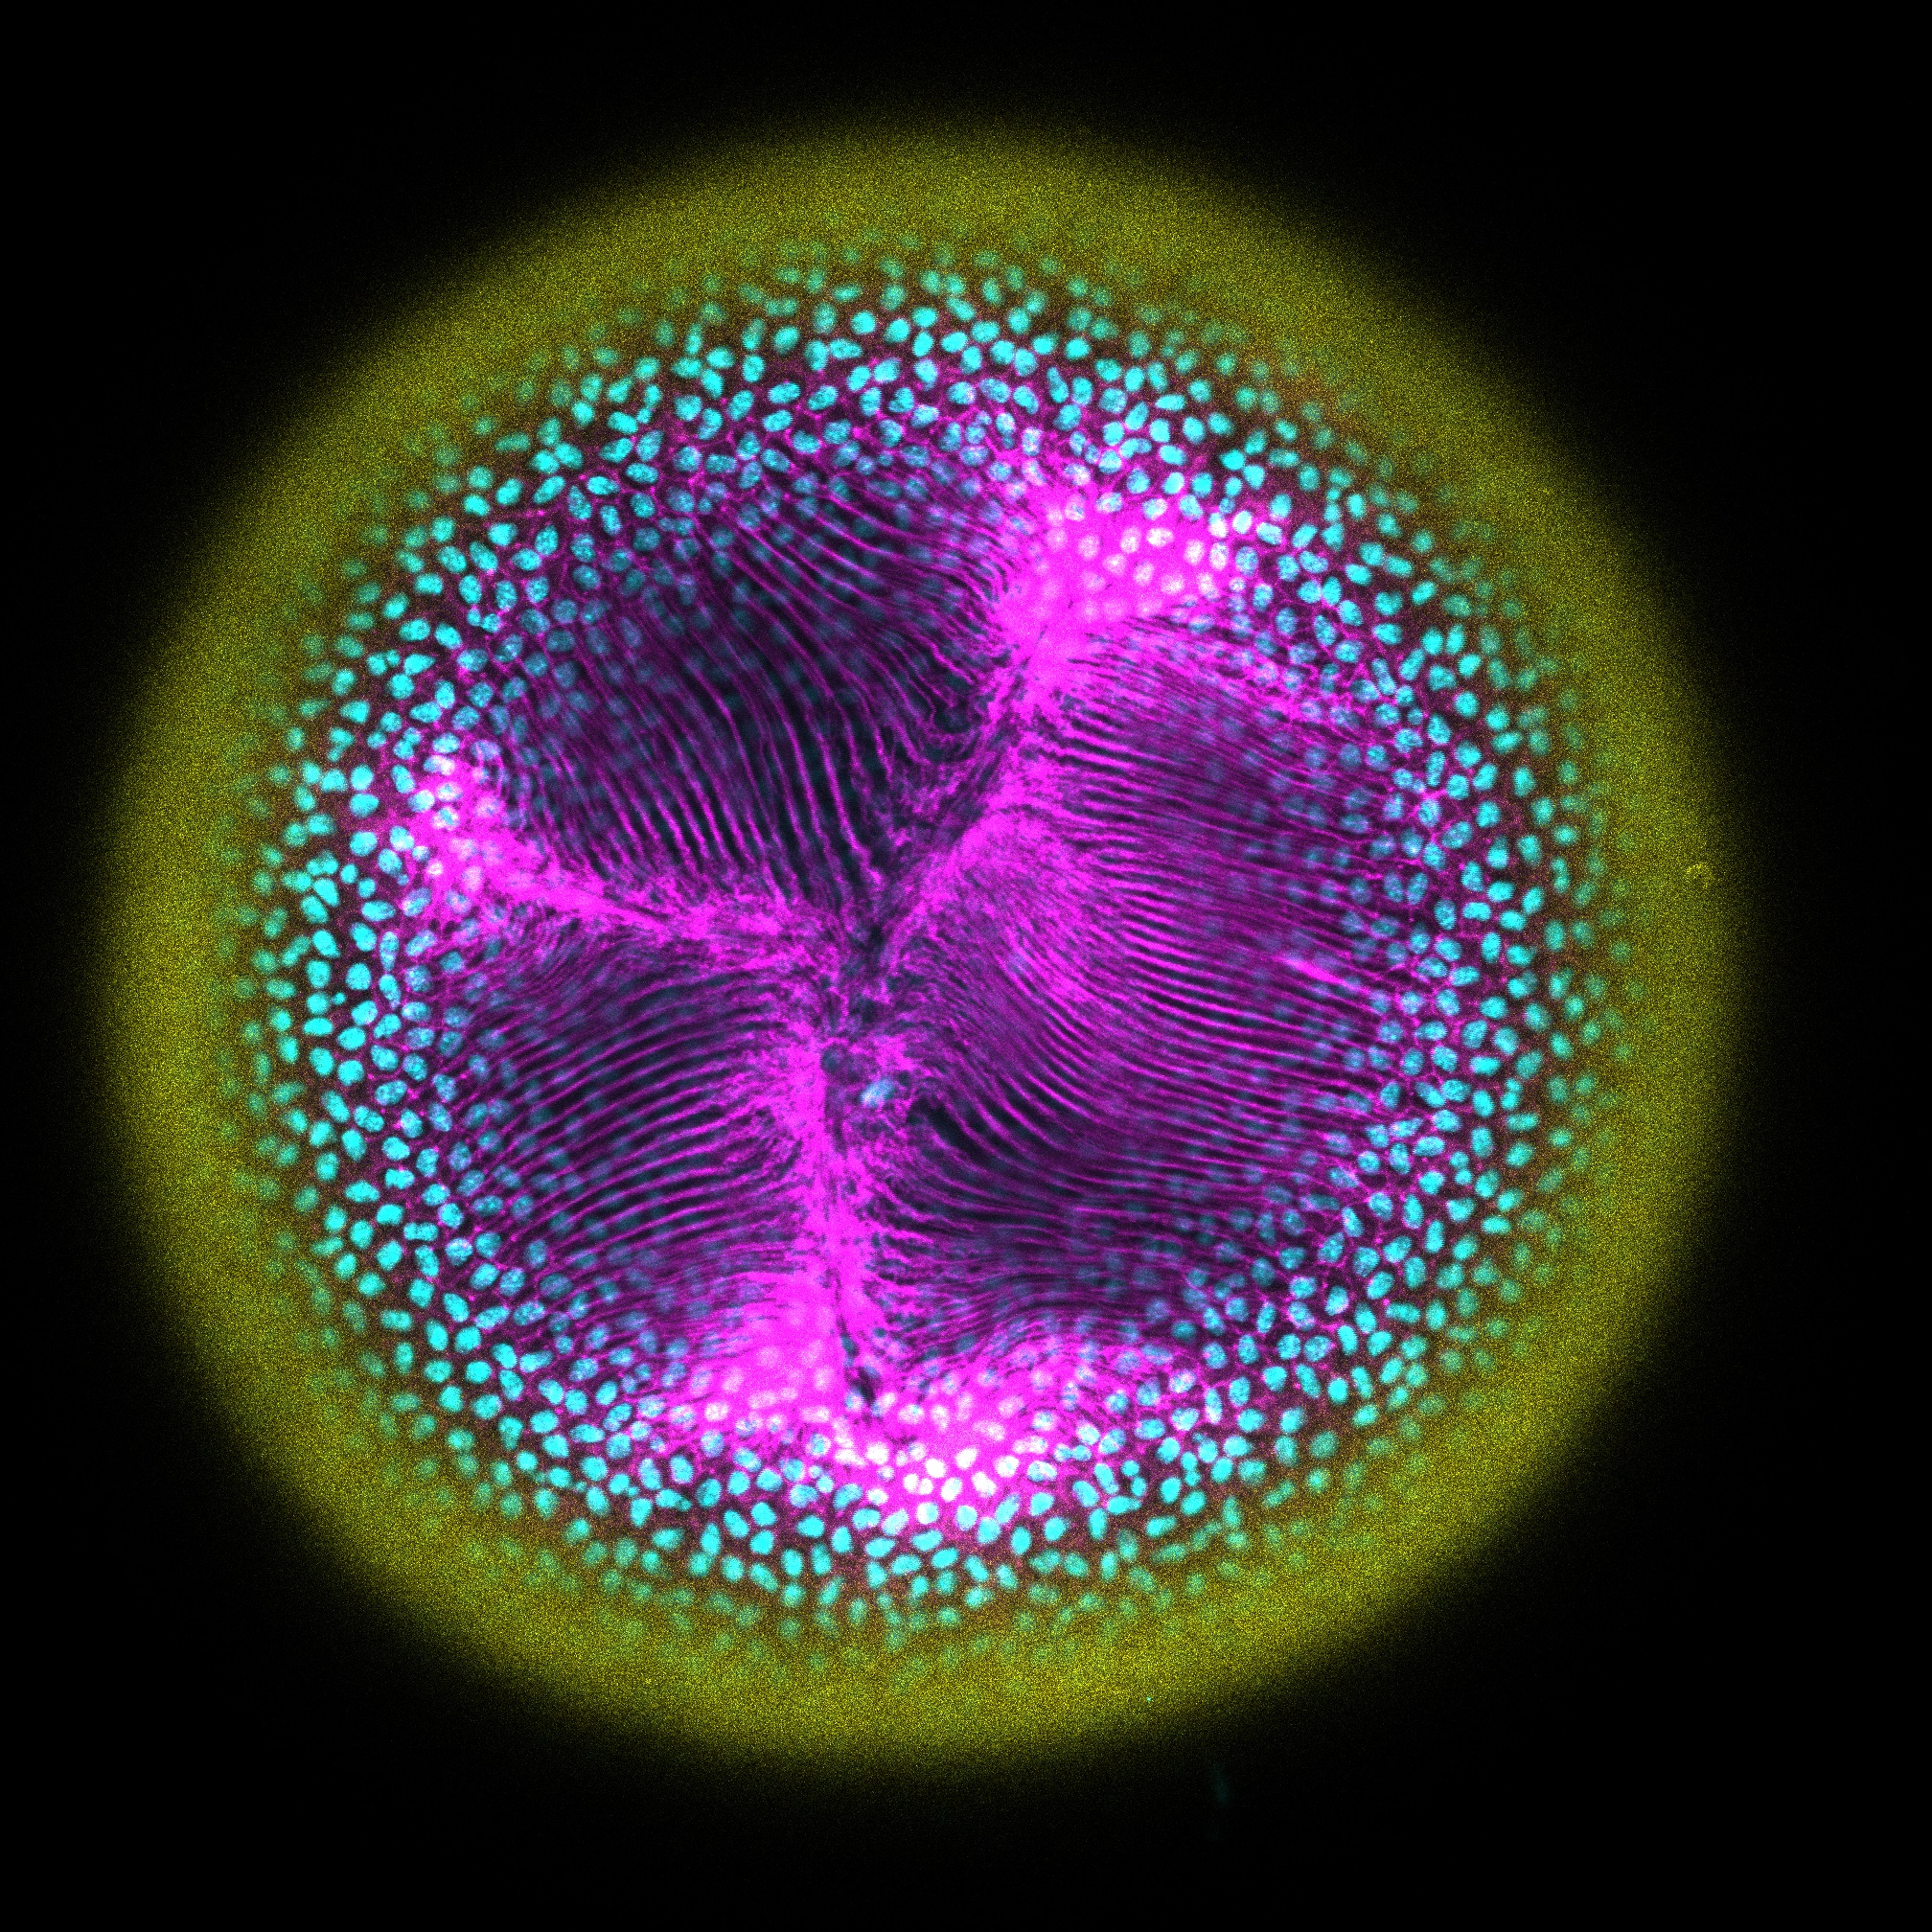
- Hexagonal Vision: Compound Eye and Sensory Crown – Frederic Bonnet
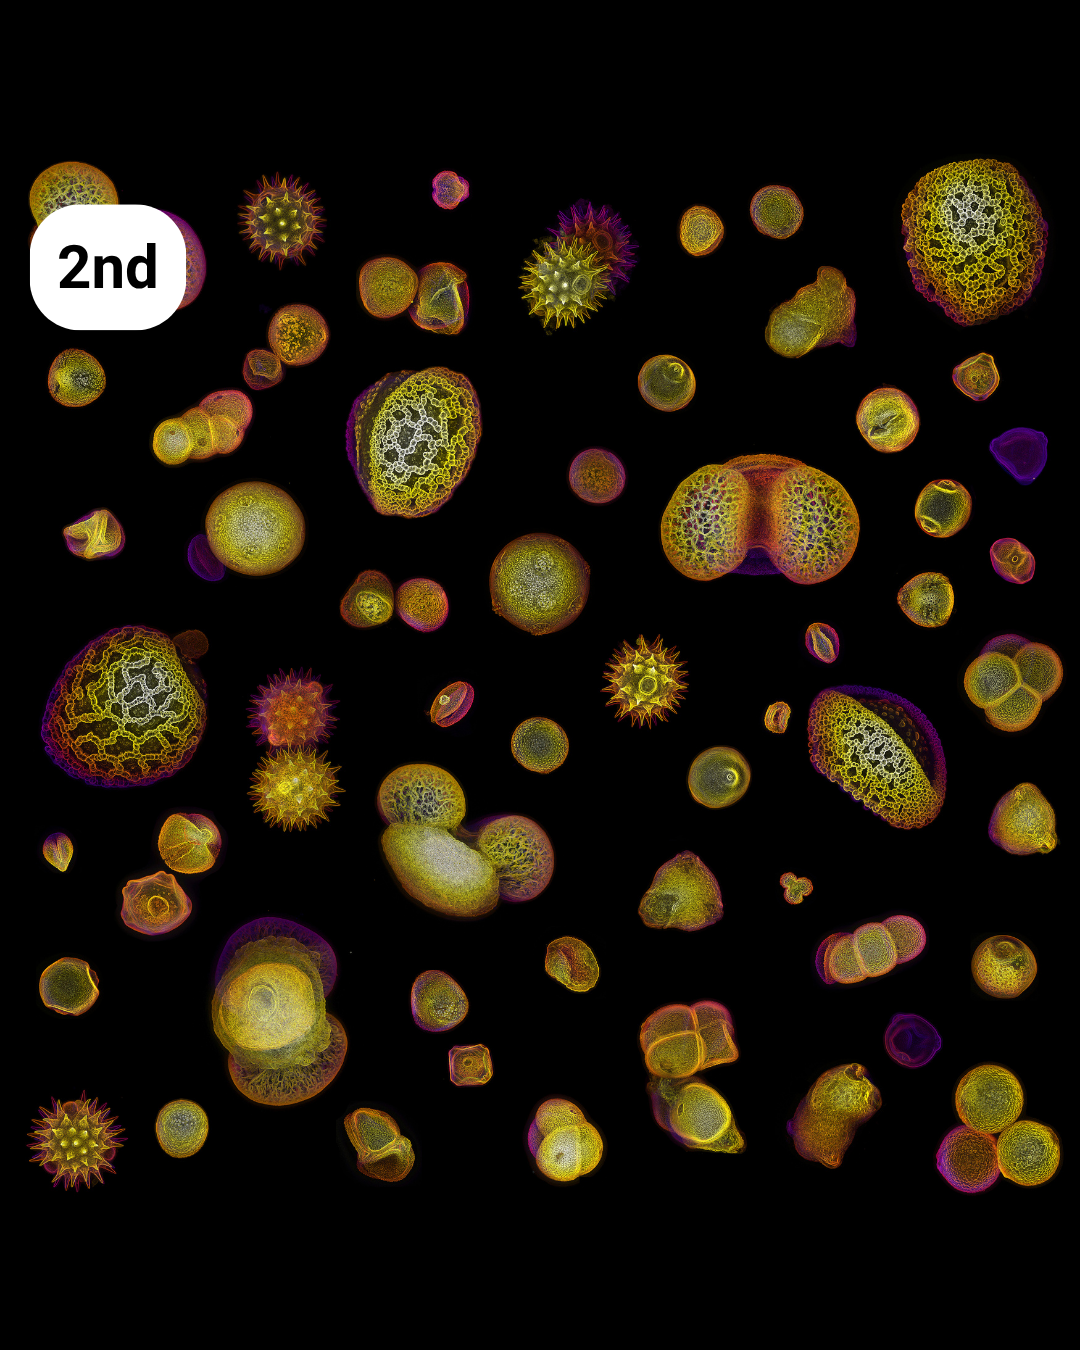
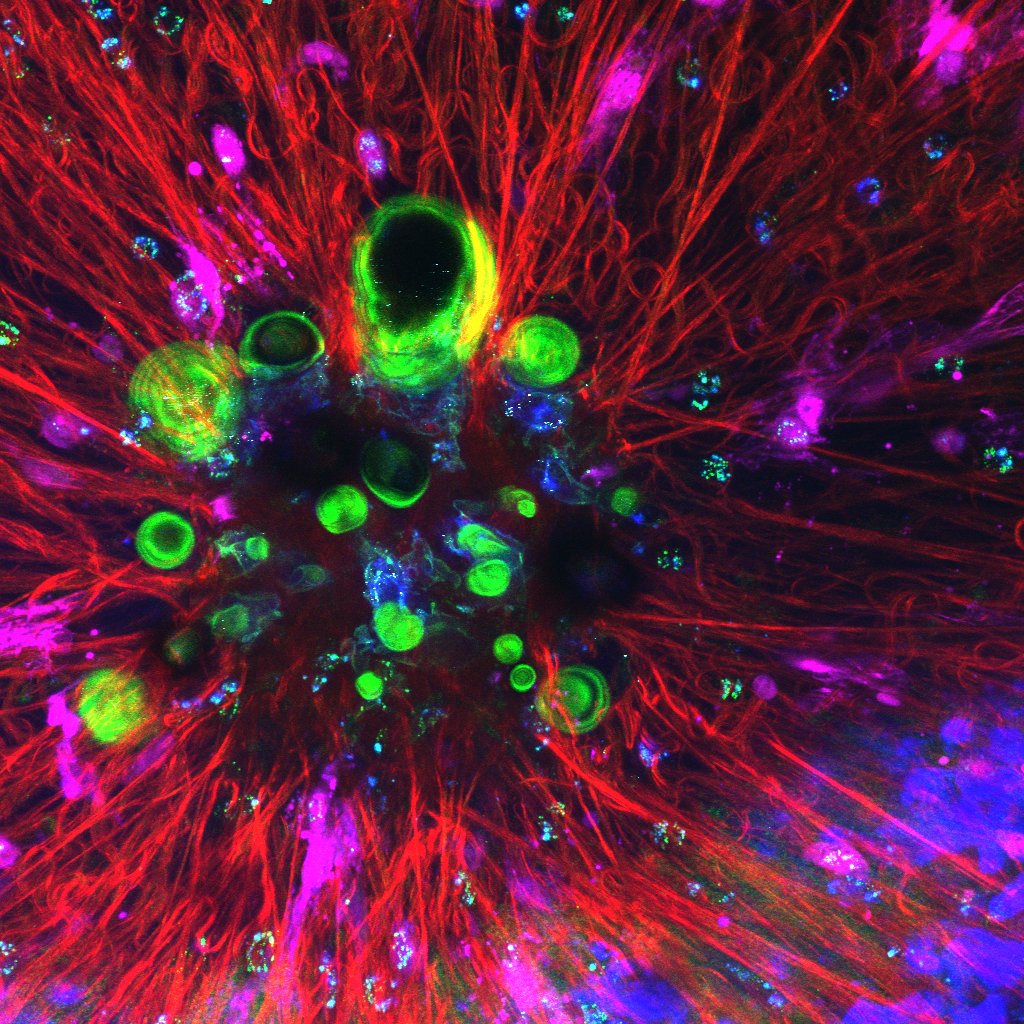
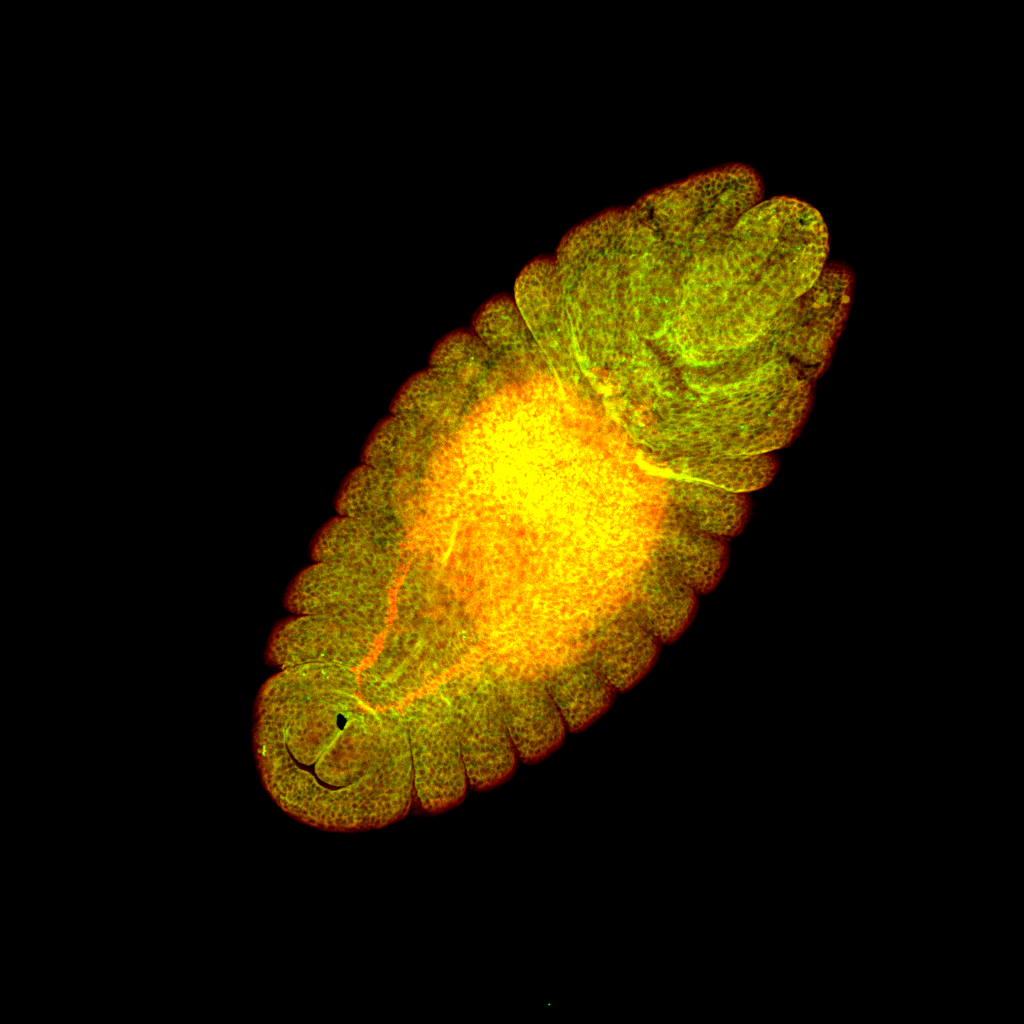
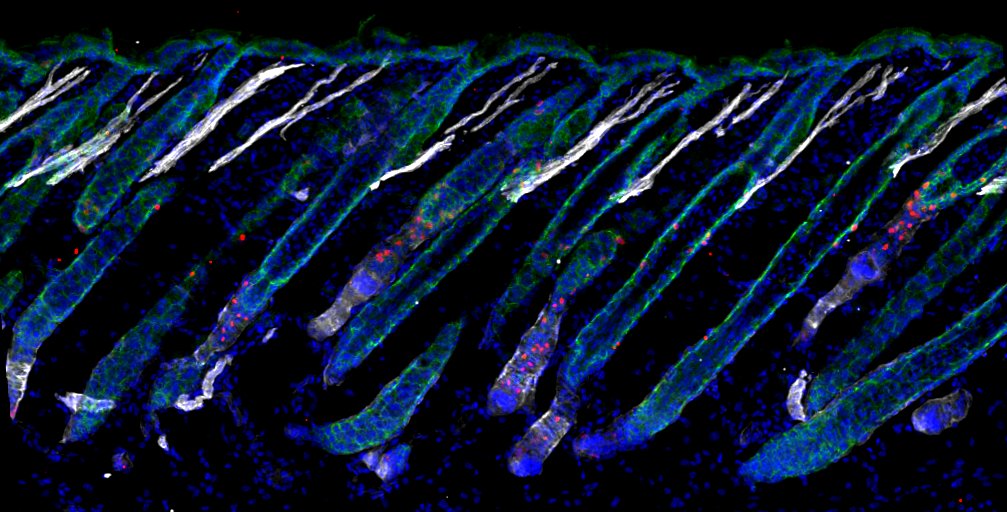
- Allergy Season – Nat Prunet
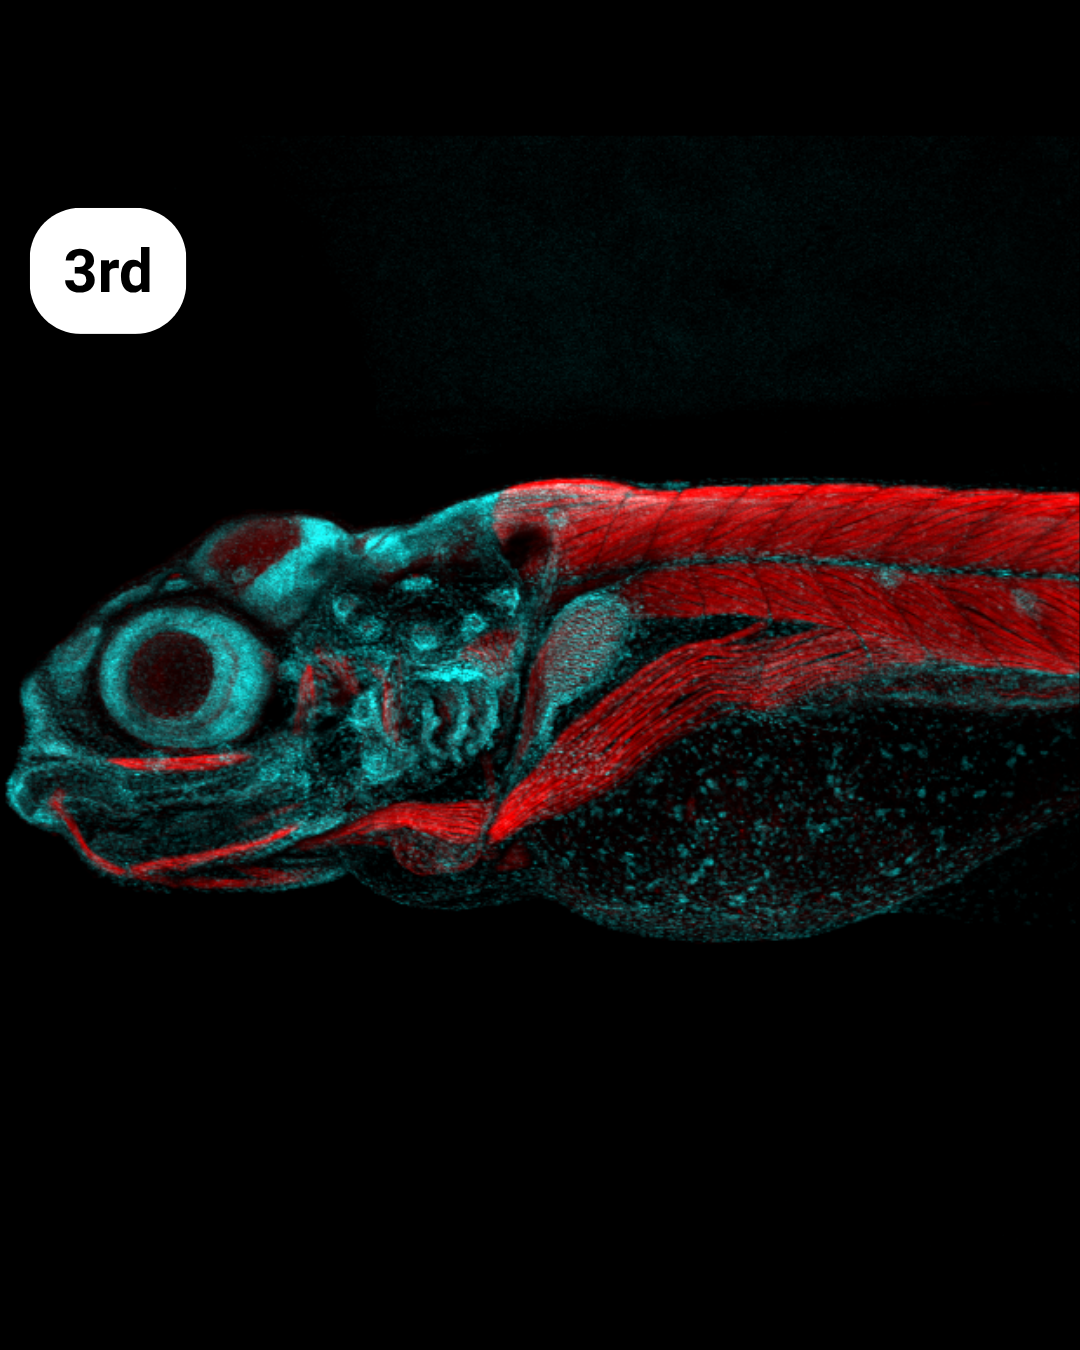
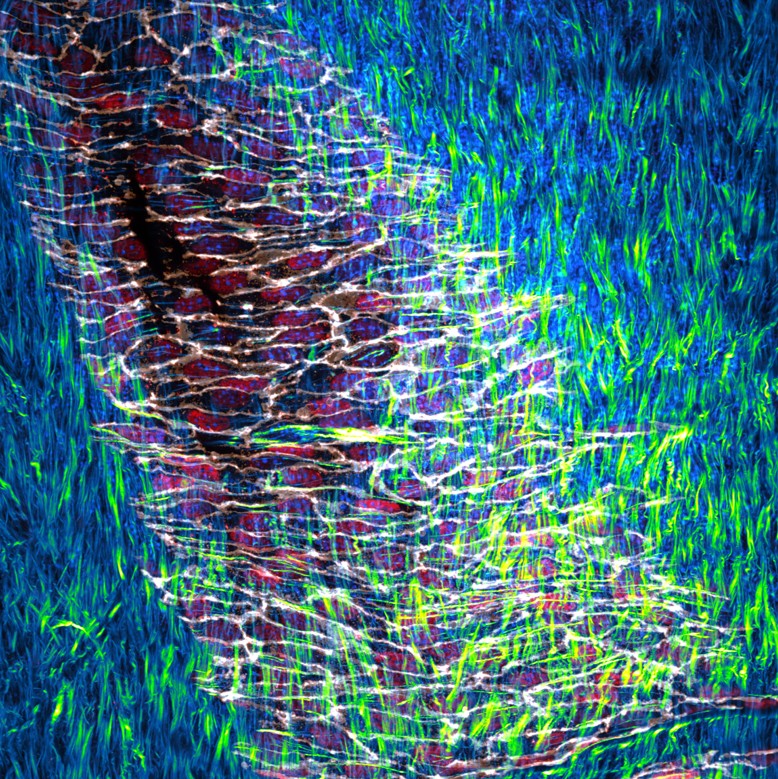
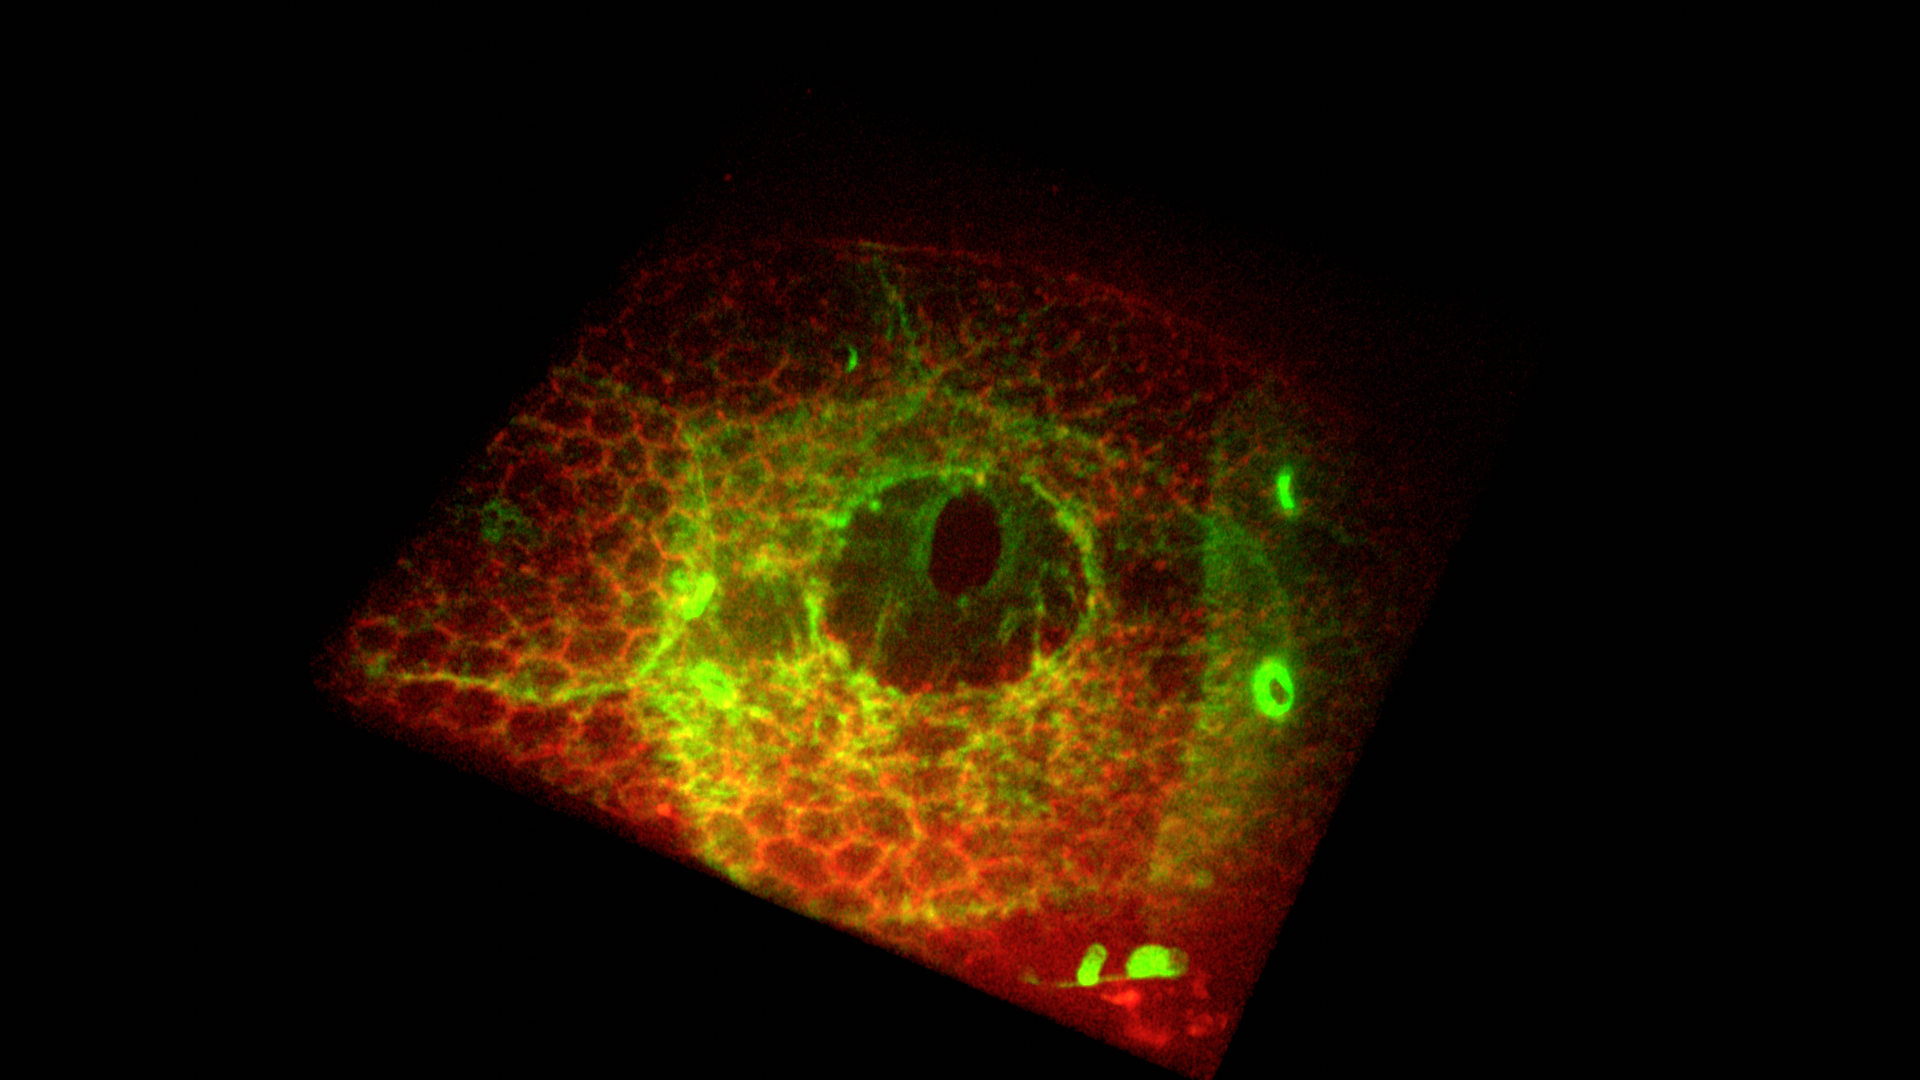
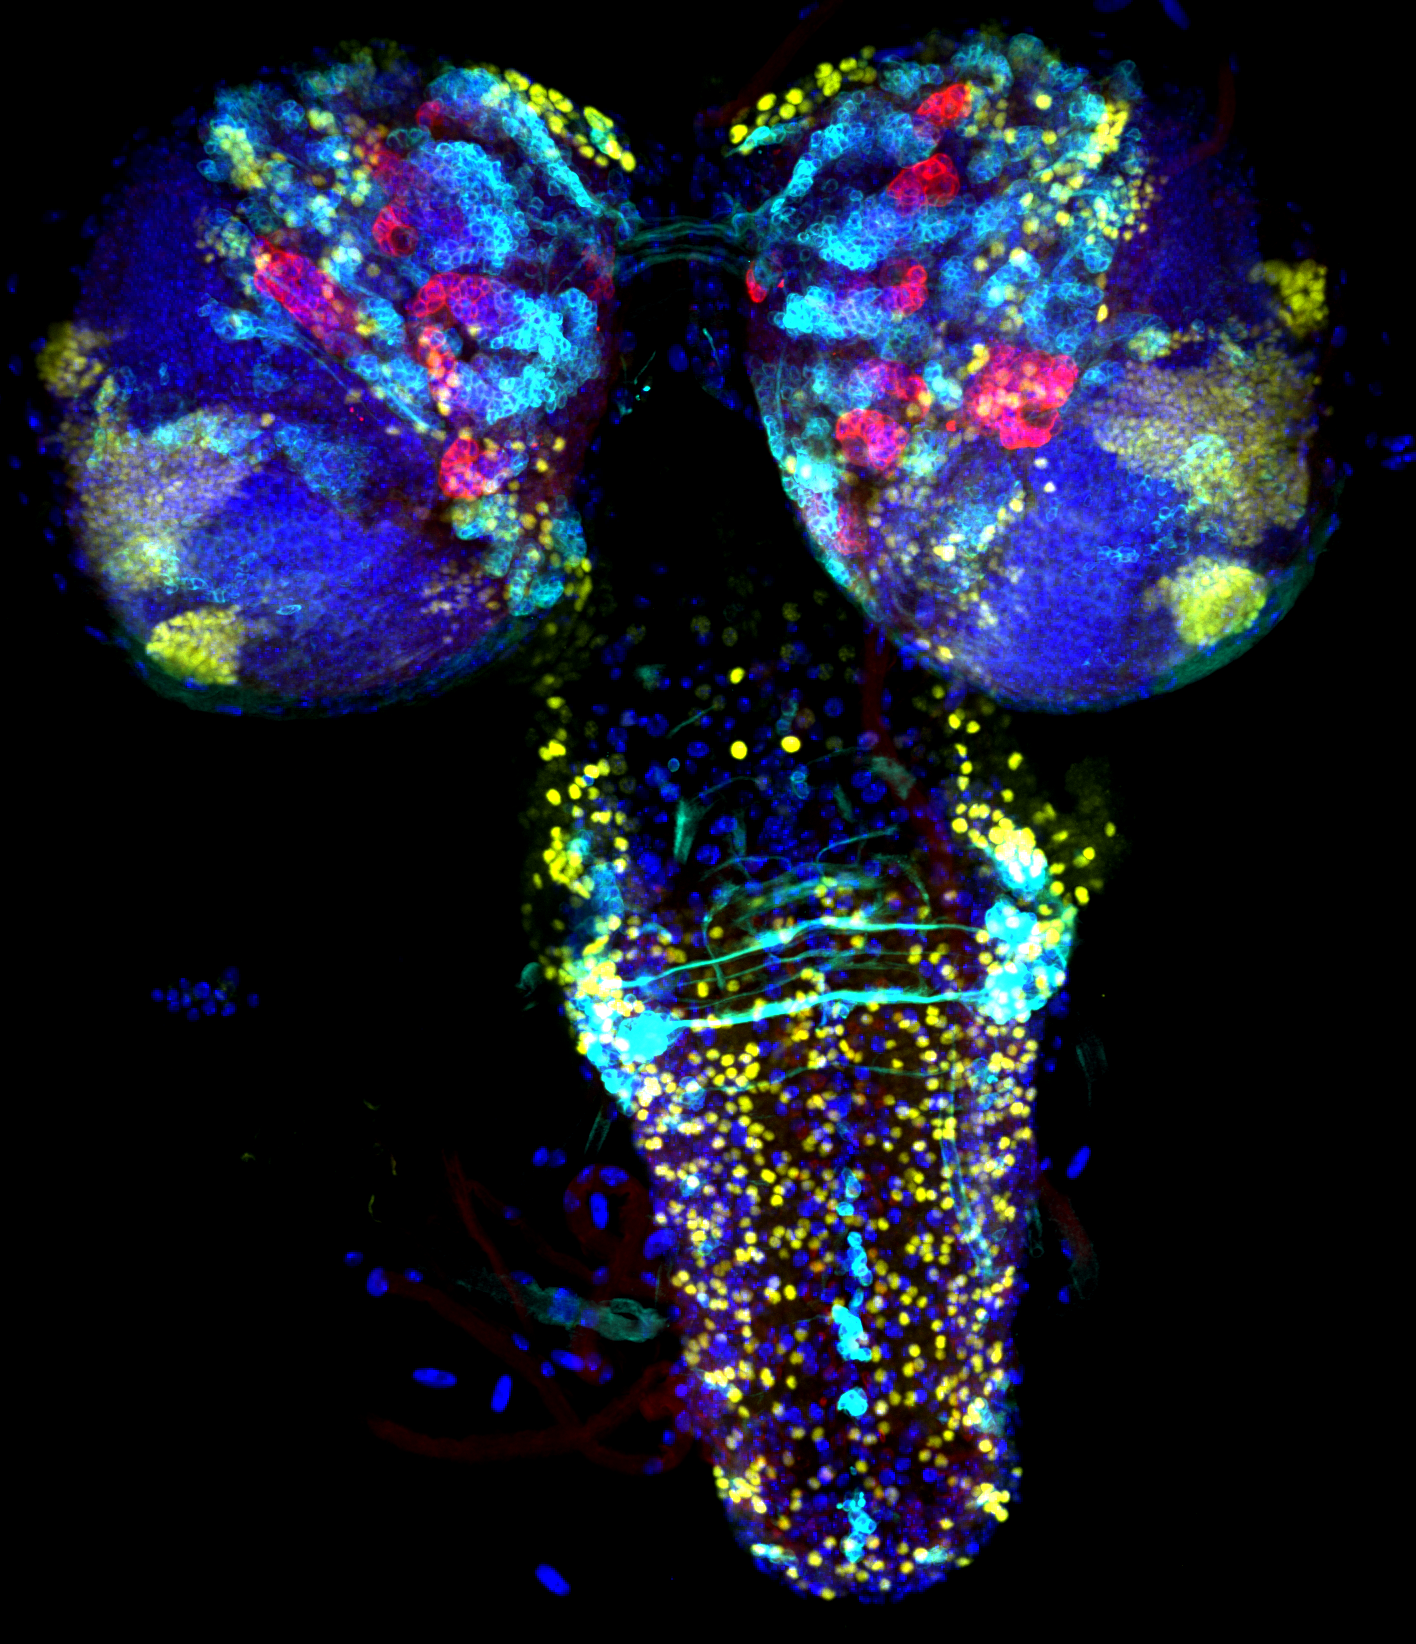
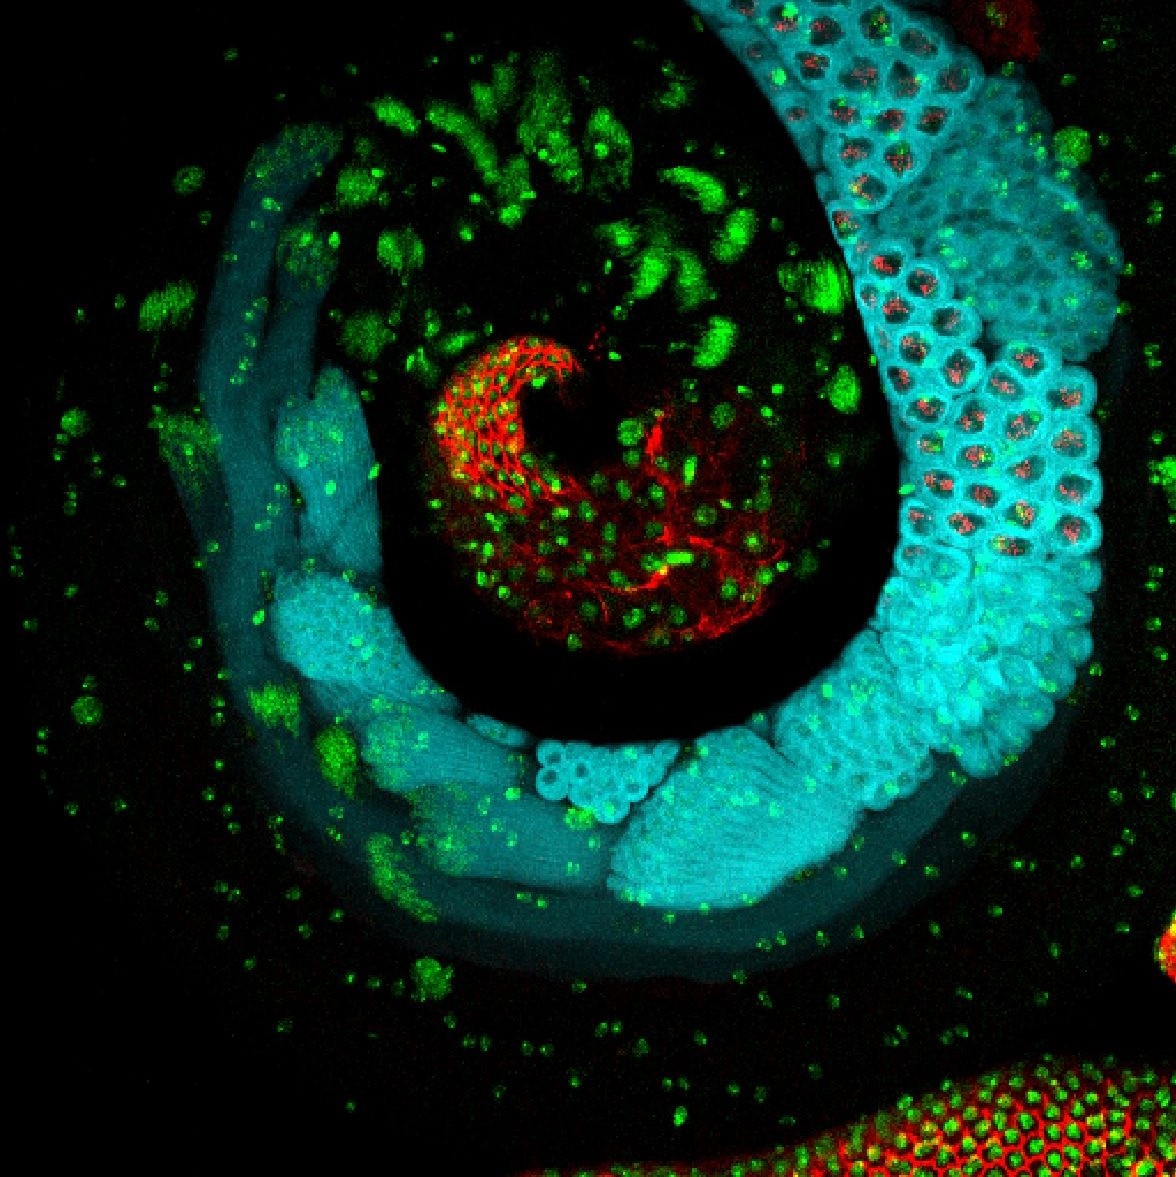
- Blue, Red and Fish – Arlen Ramírez Corona
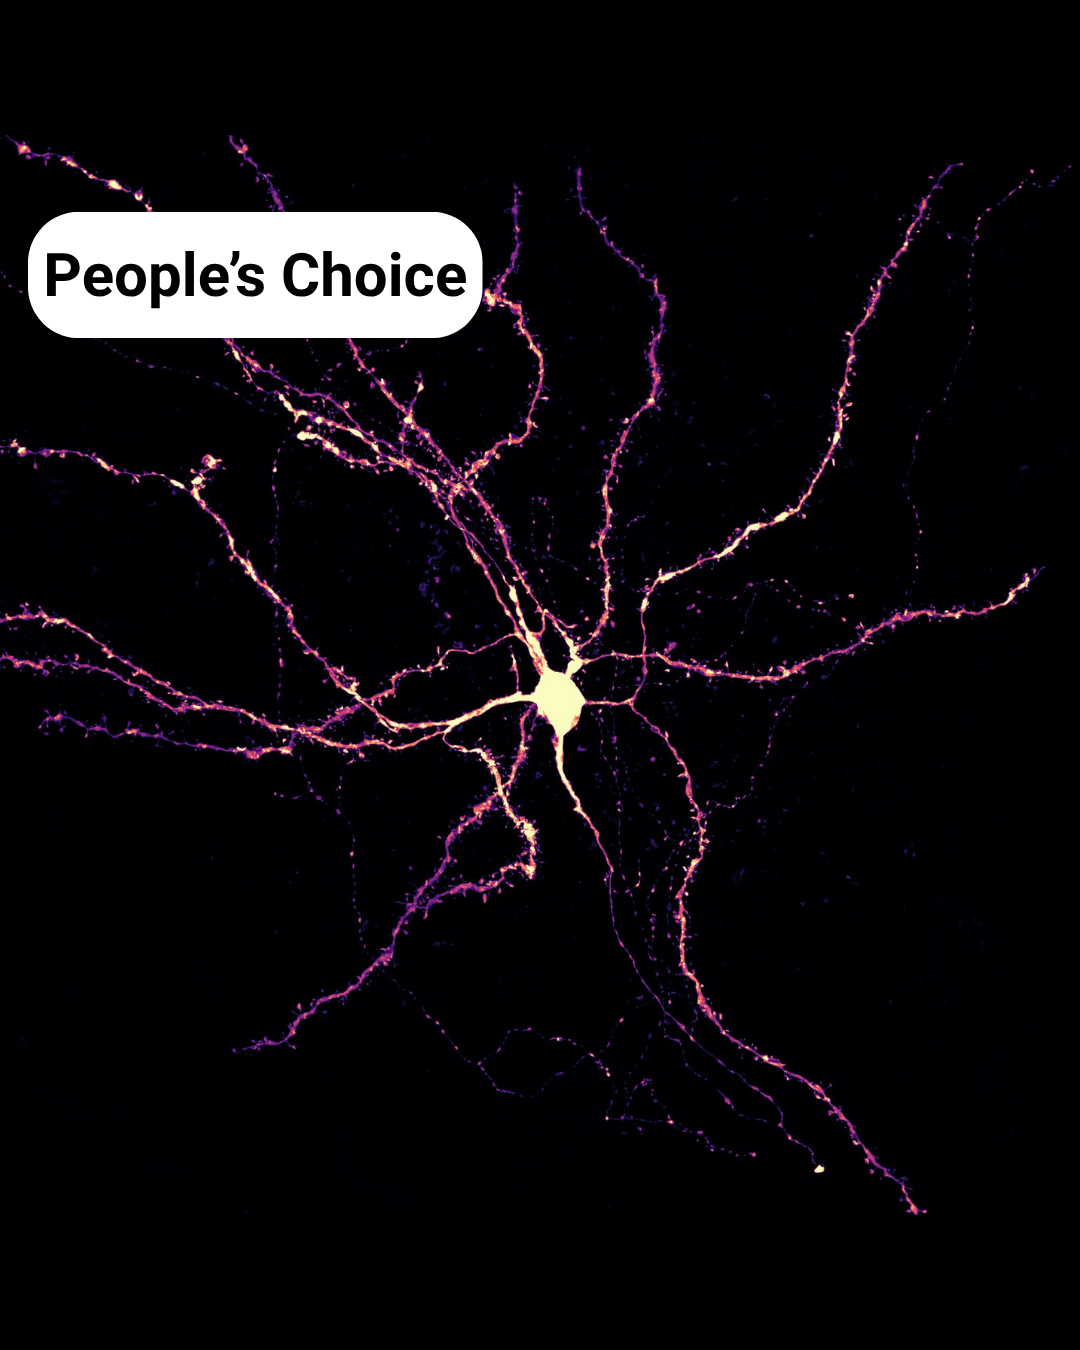
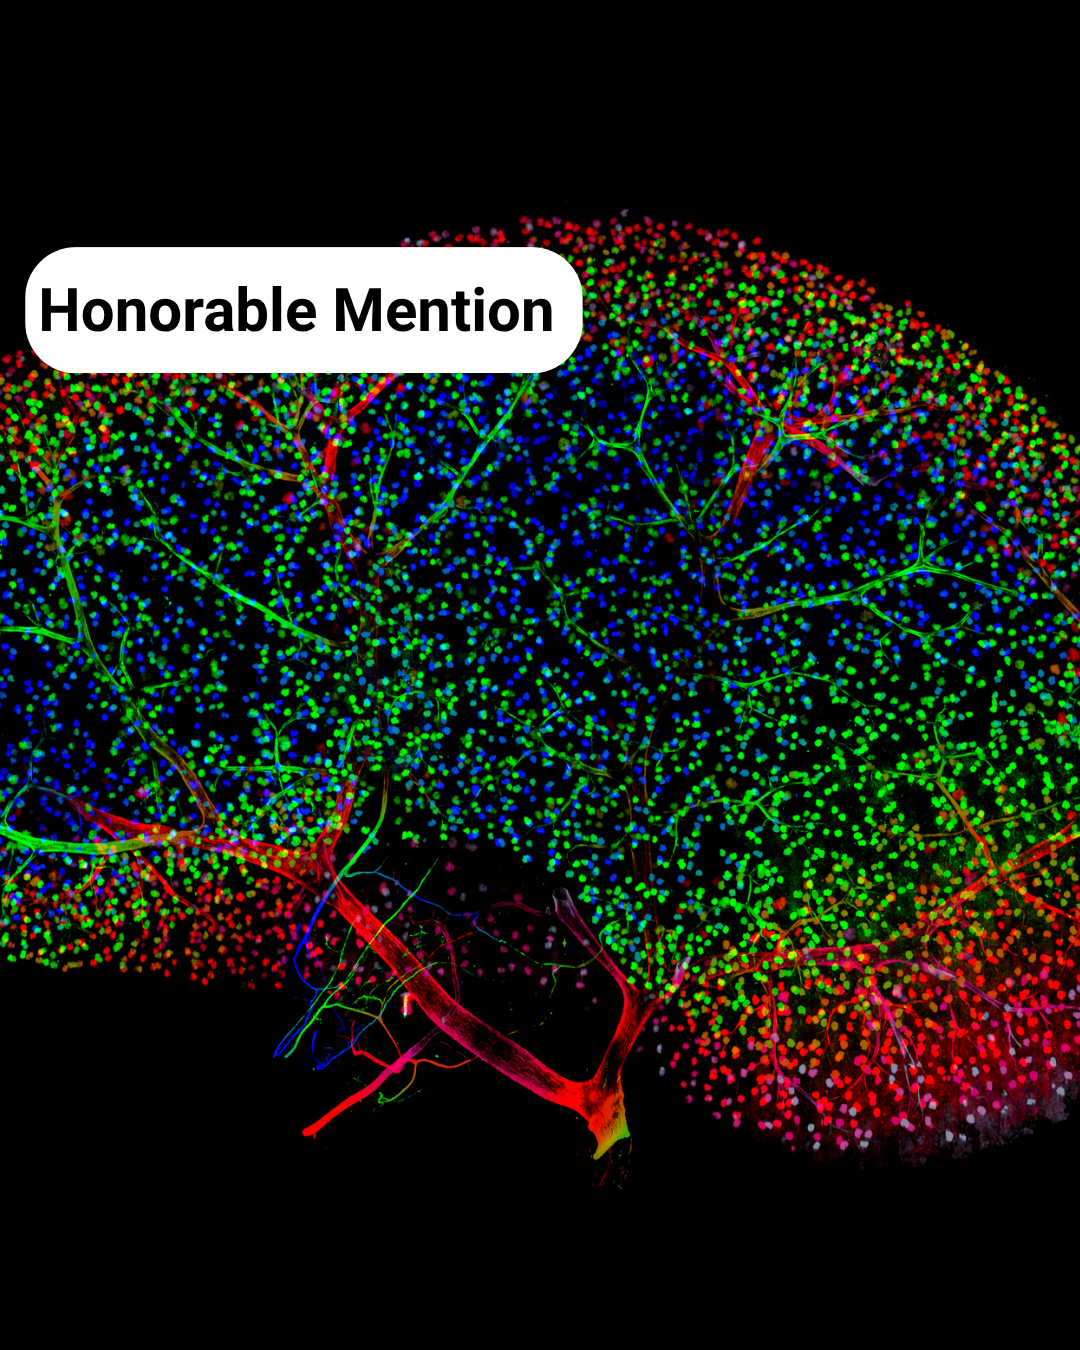
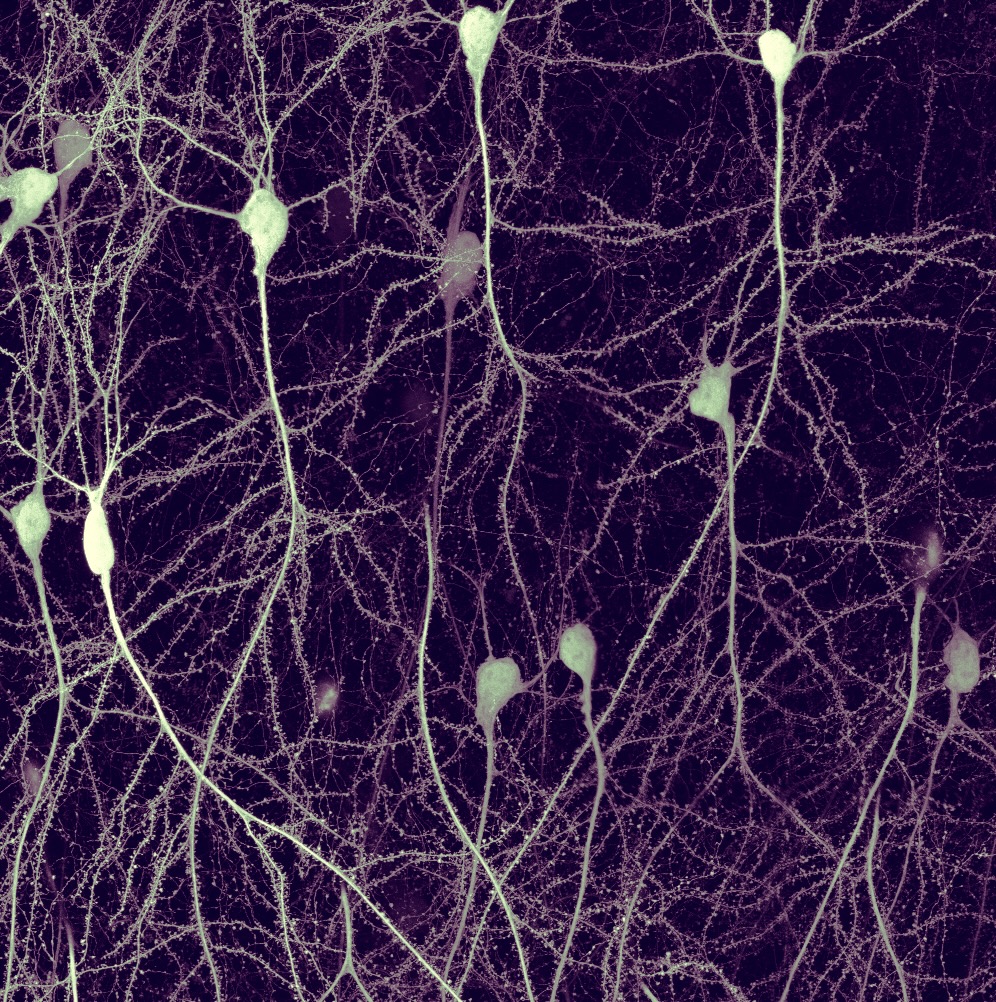
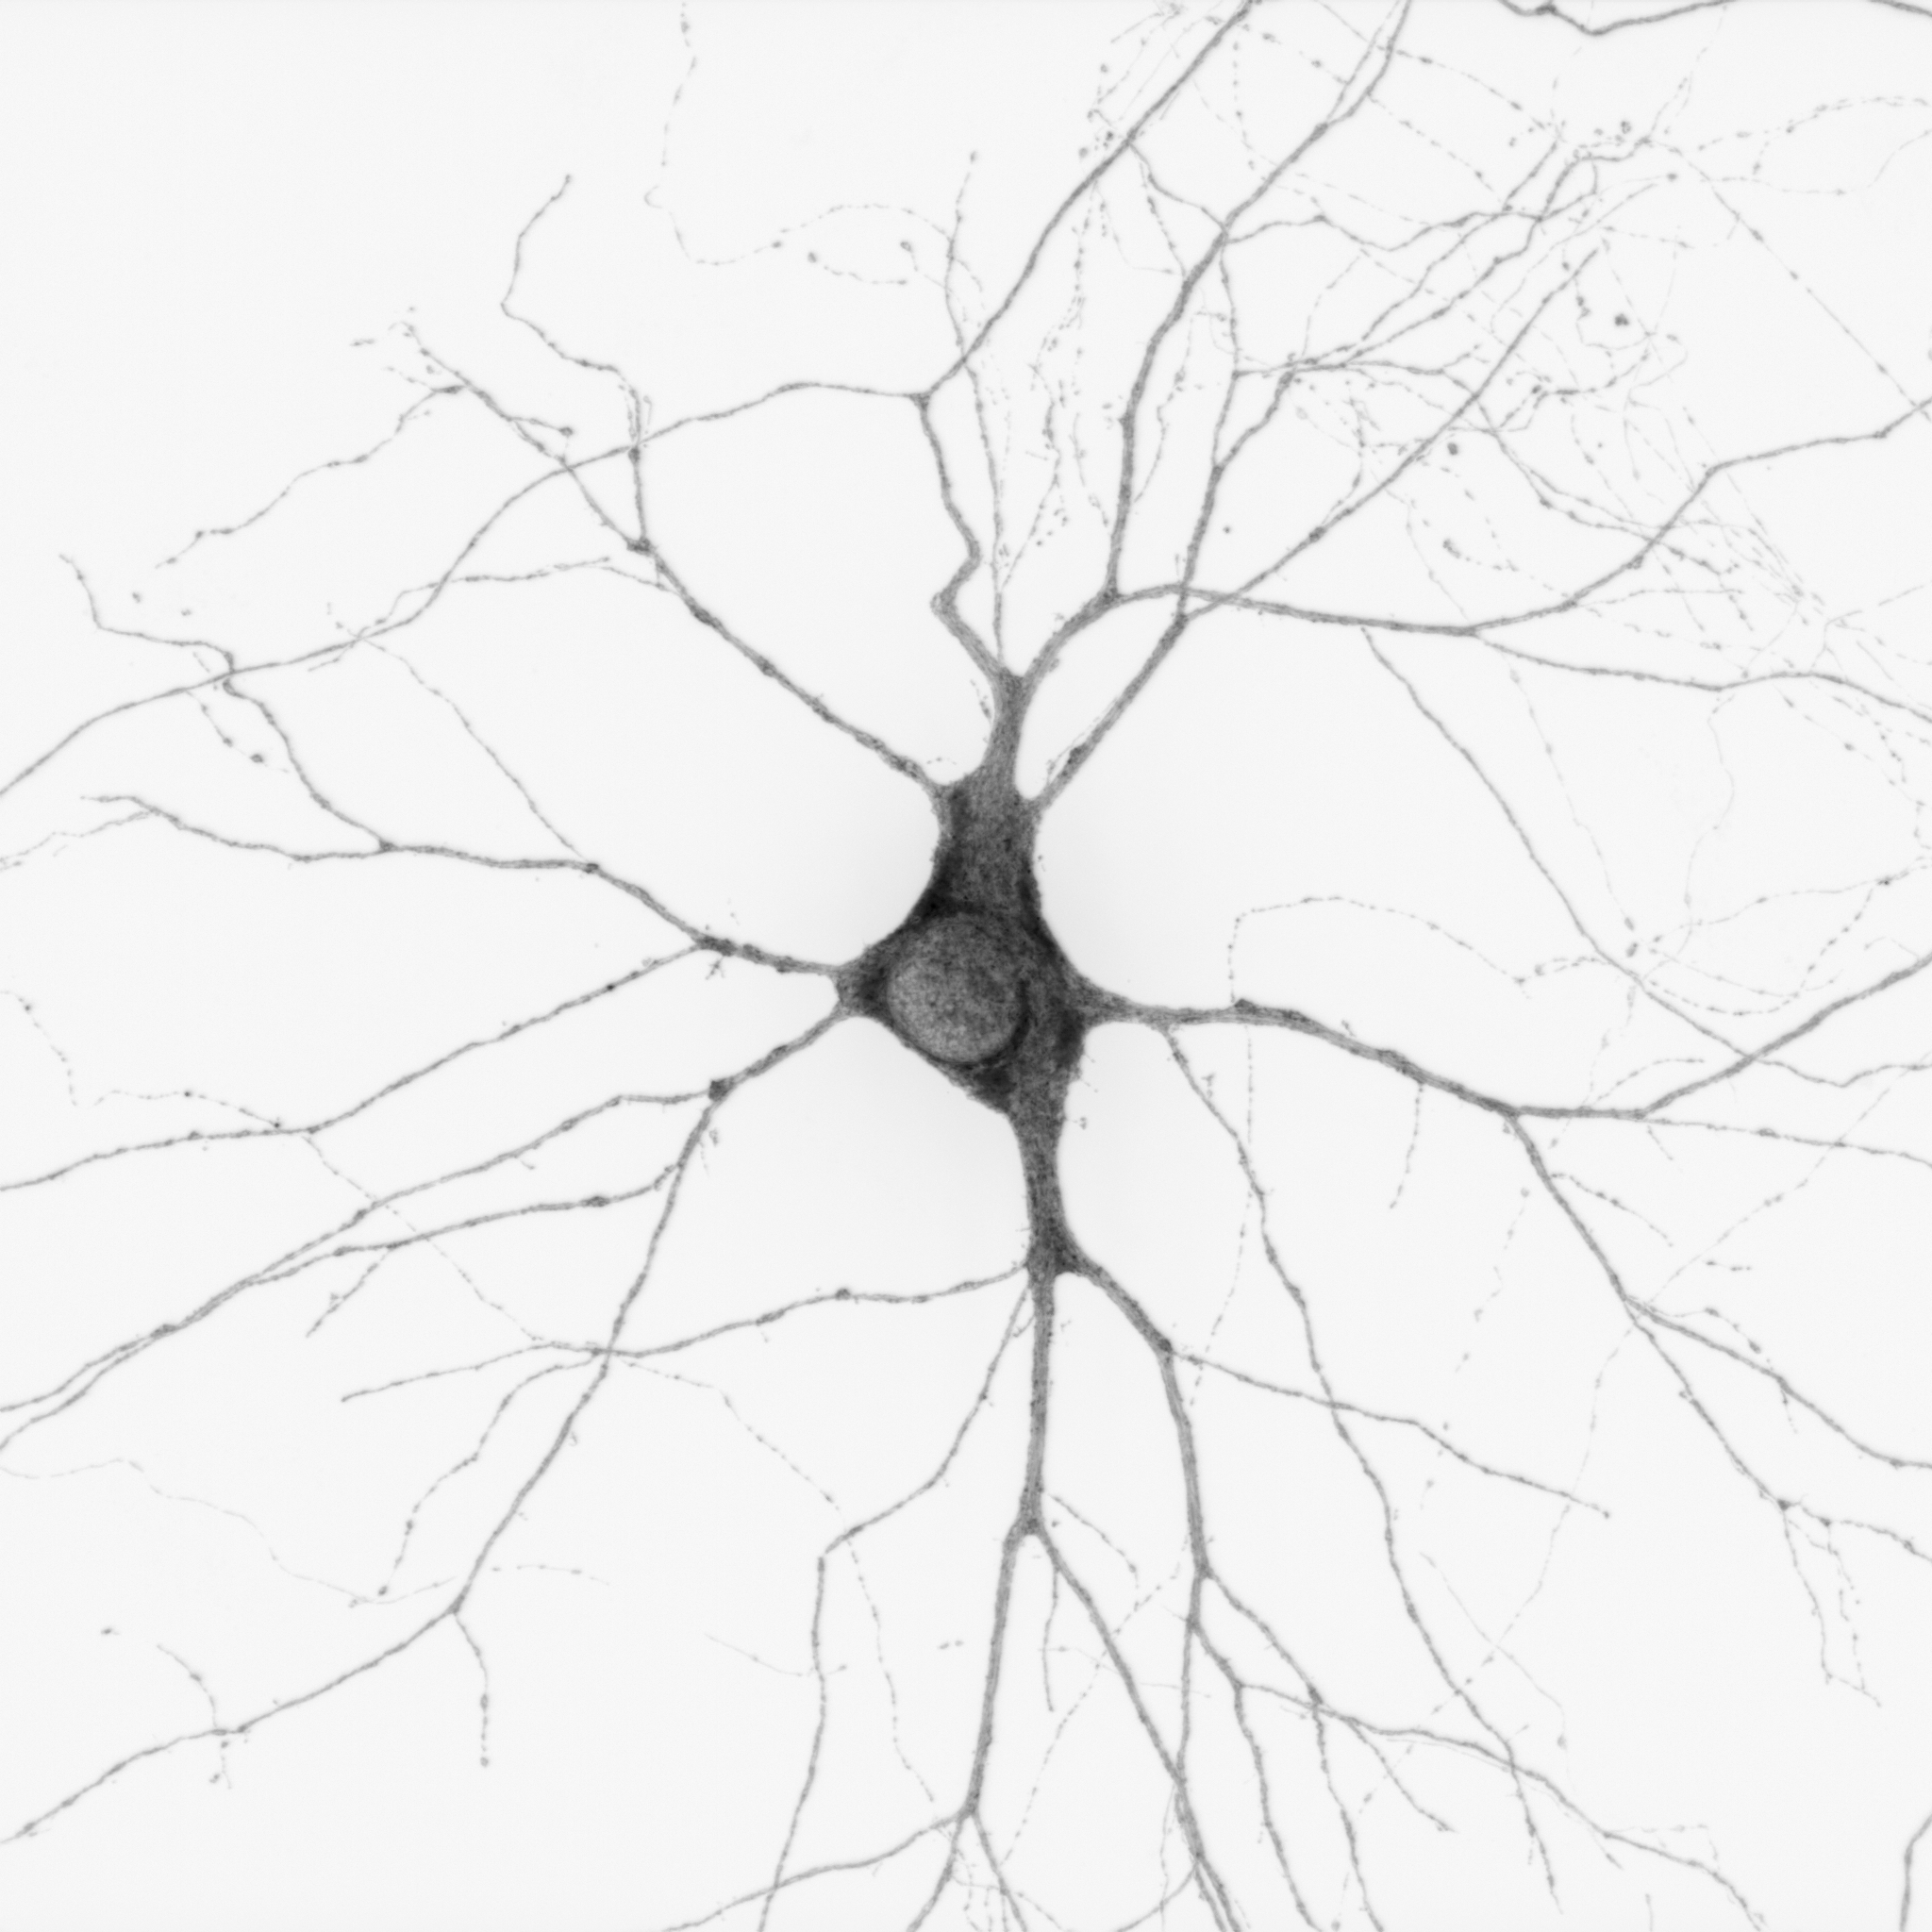
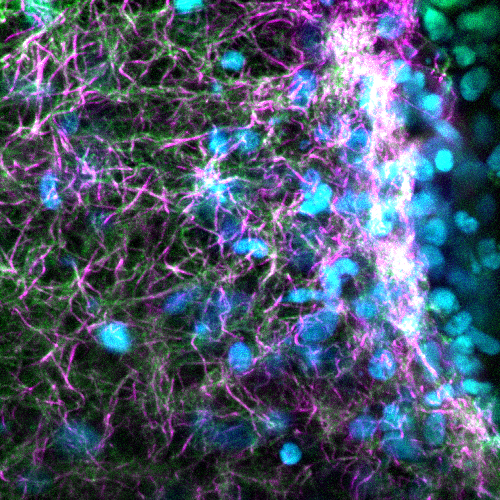
The People’s Choice Award is: Dentritic constellation – Mahgol Darvishmolla
Honorable Mentions (alpha order)
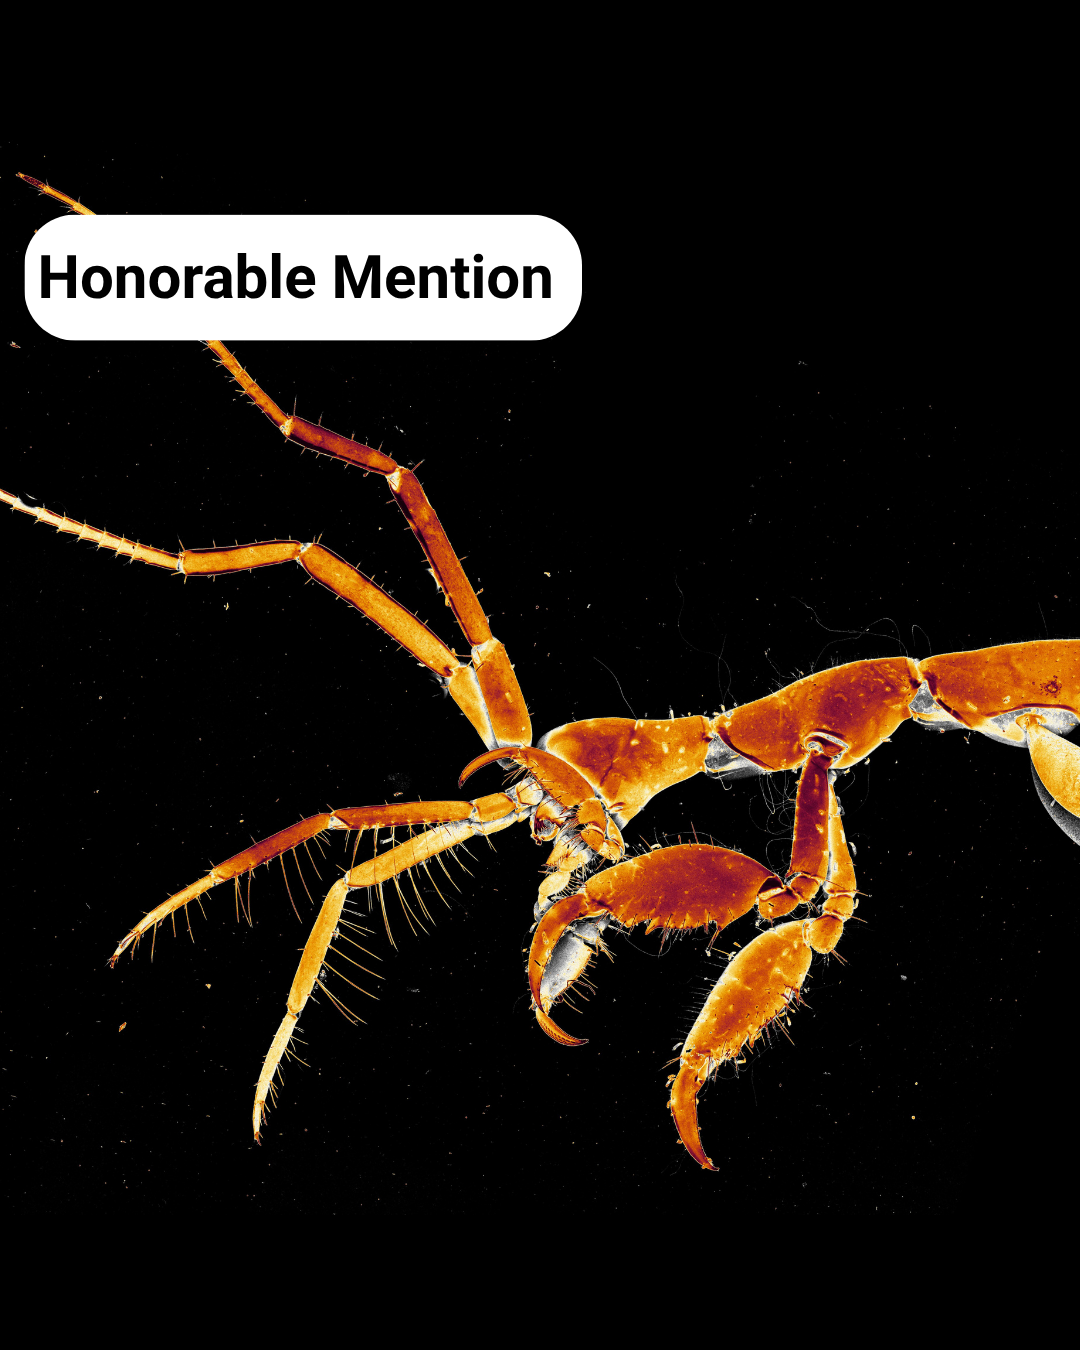
- Textures of a Skeleton Shrimp – Caroline Hoppe
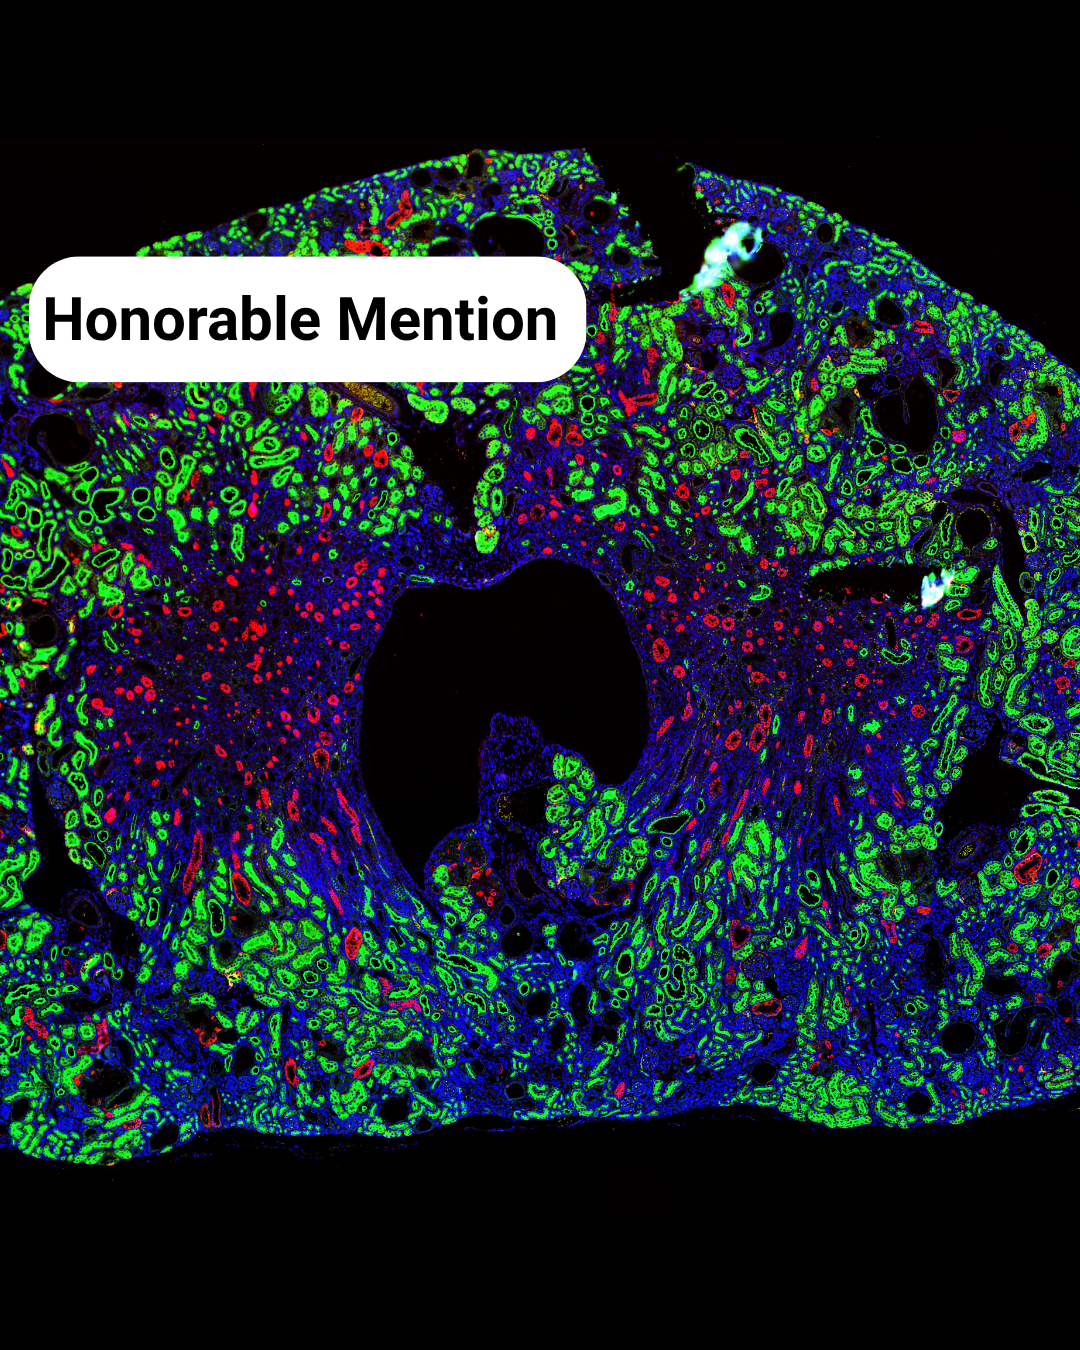
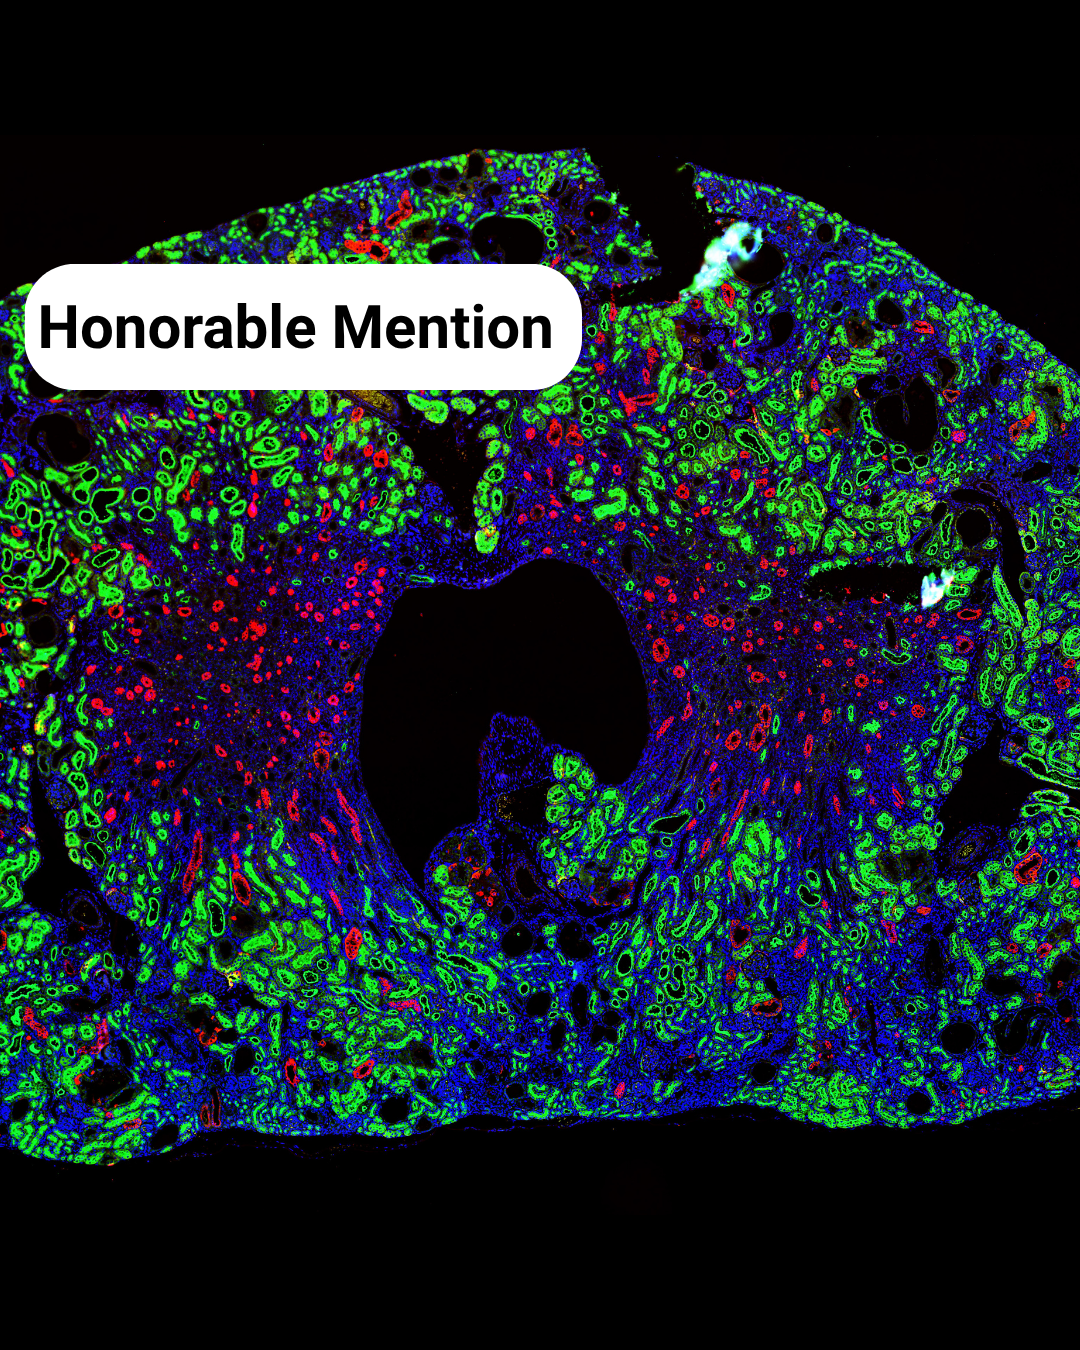
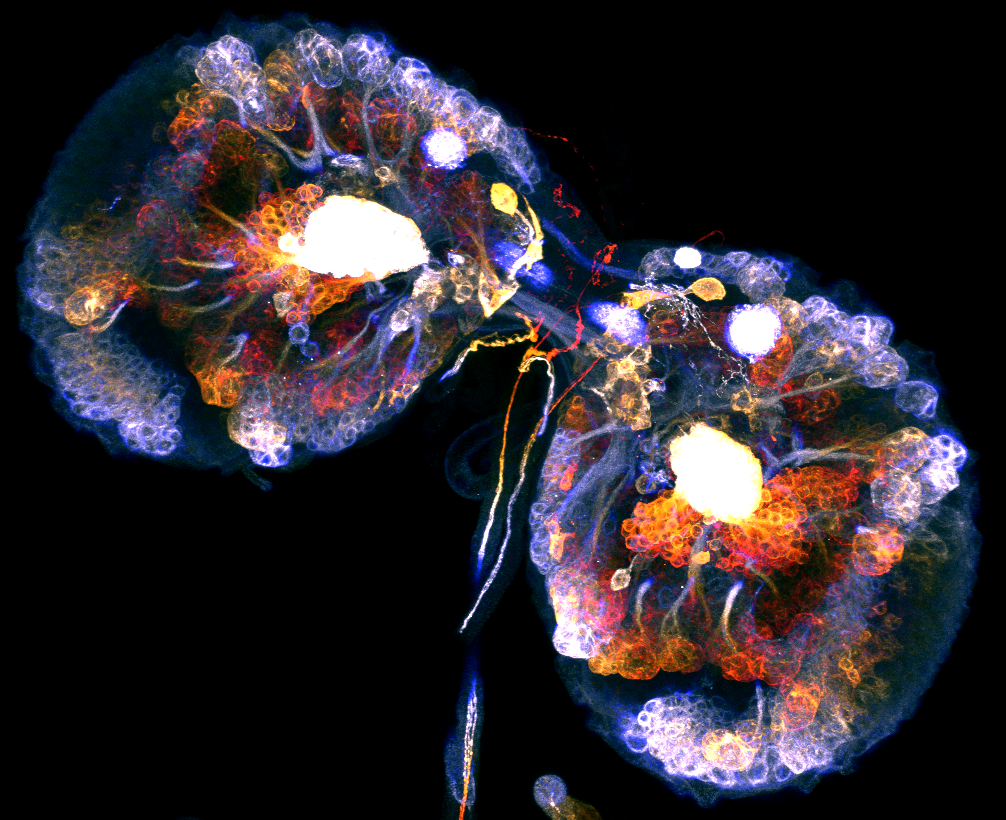
- Mouse Kidney Disco – Chetan Poudel
- The Kidney Landscape** – Meriam Shabbar
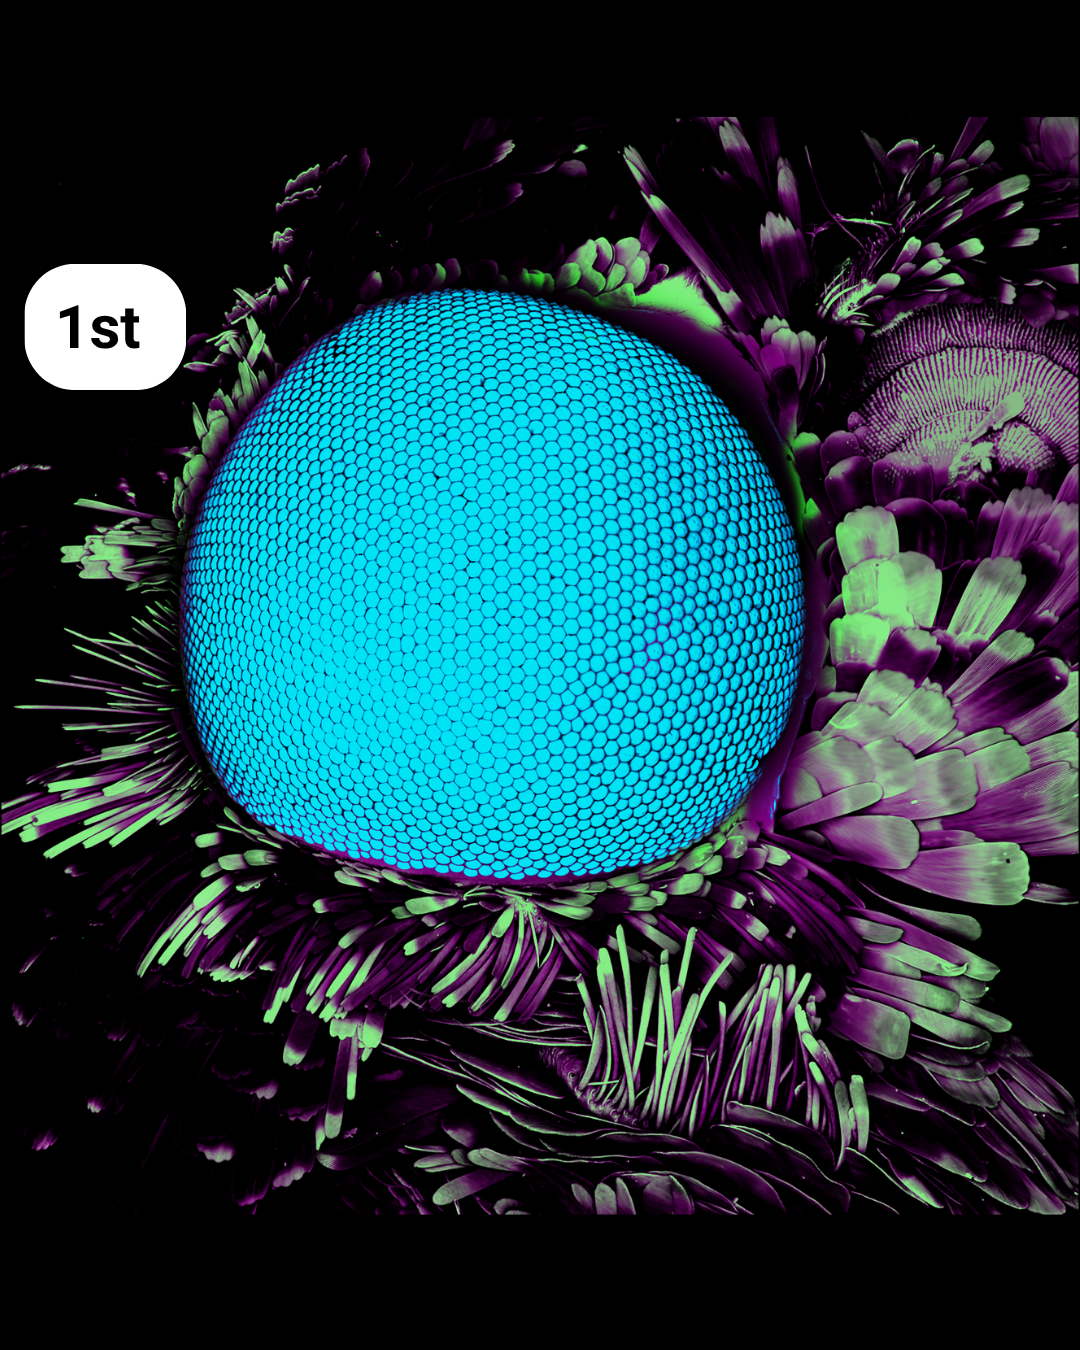
Hexagonal Vision: Compound Eye and Sensory Crown– Frederic Bonnet
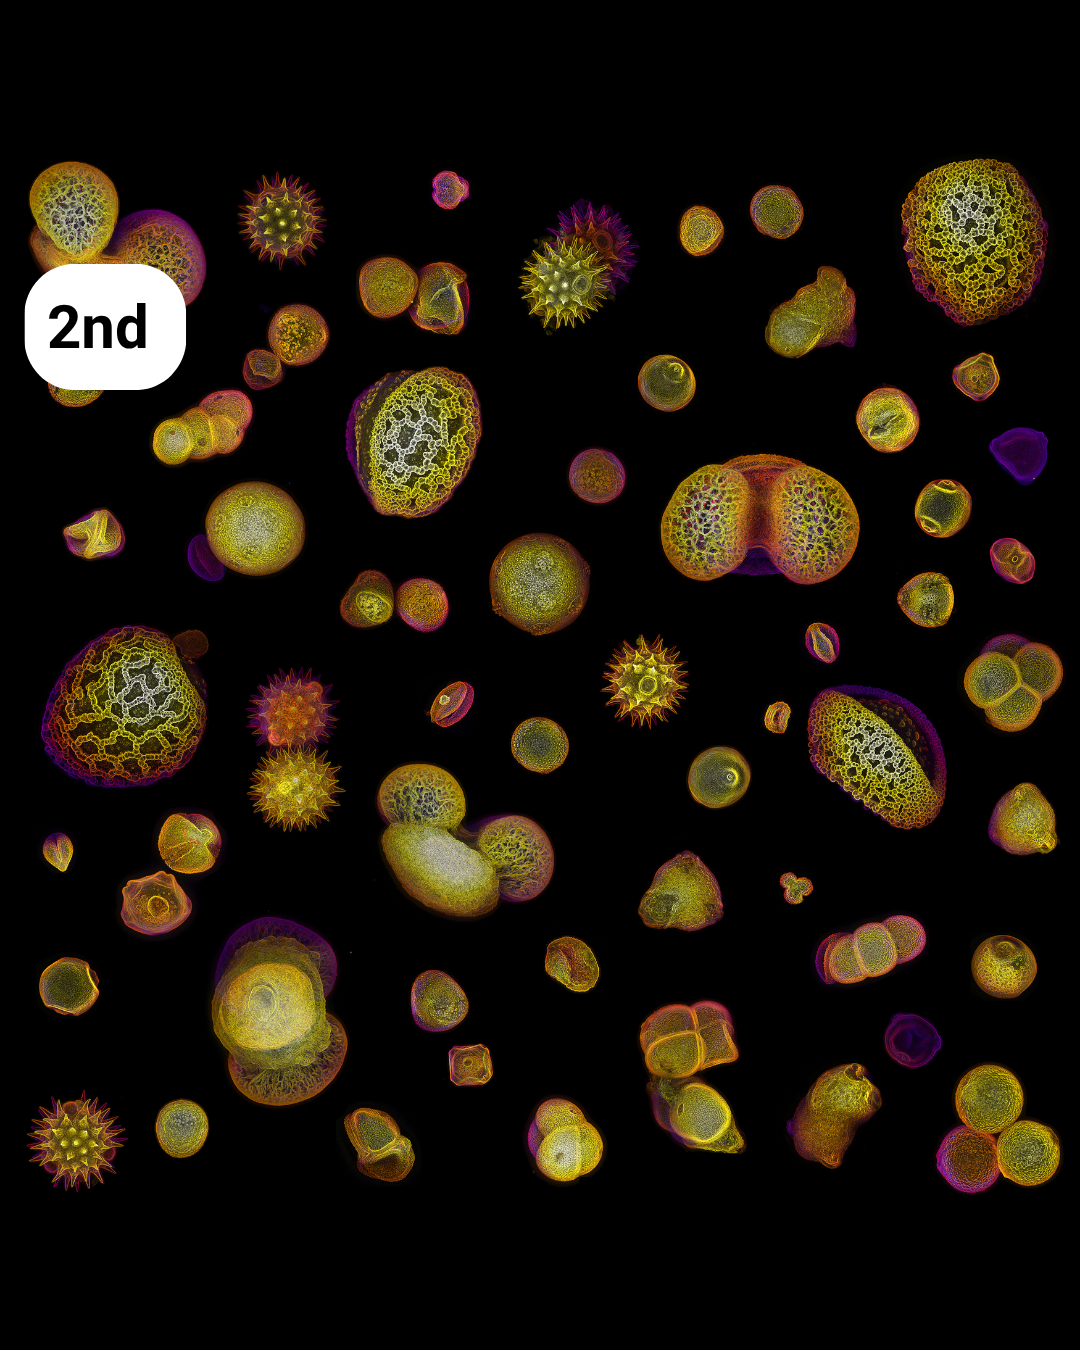
Allergy season– Nat Prunet
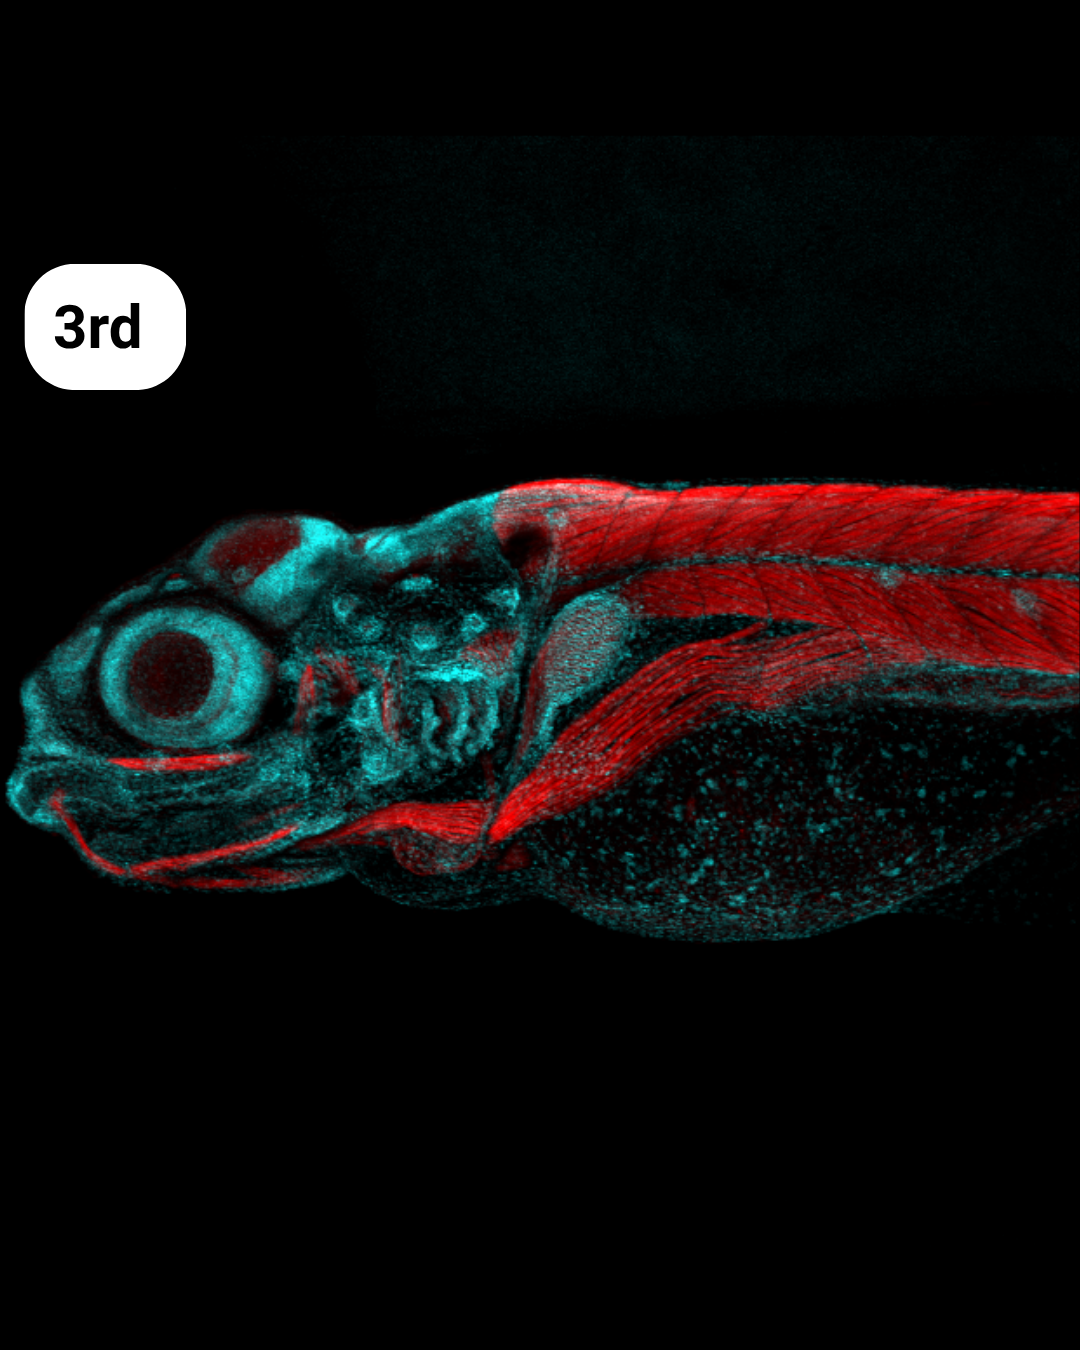
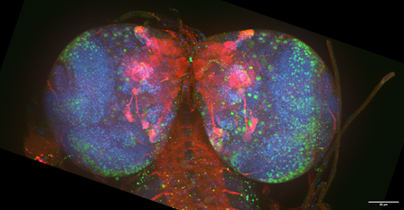
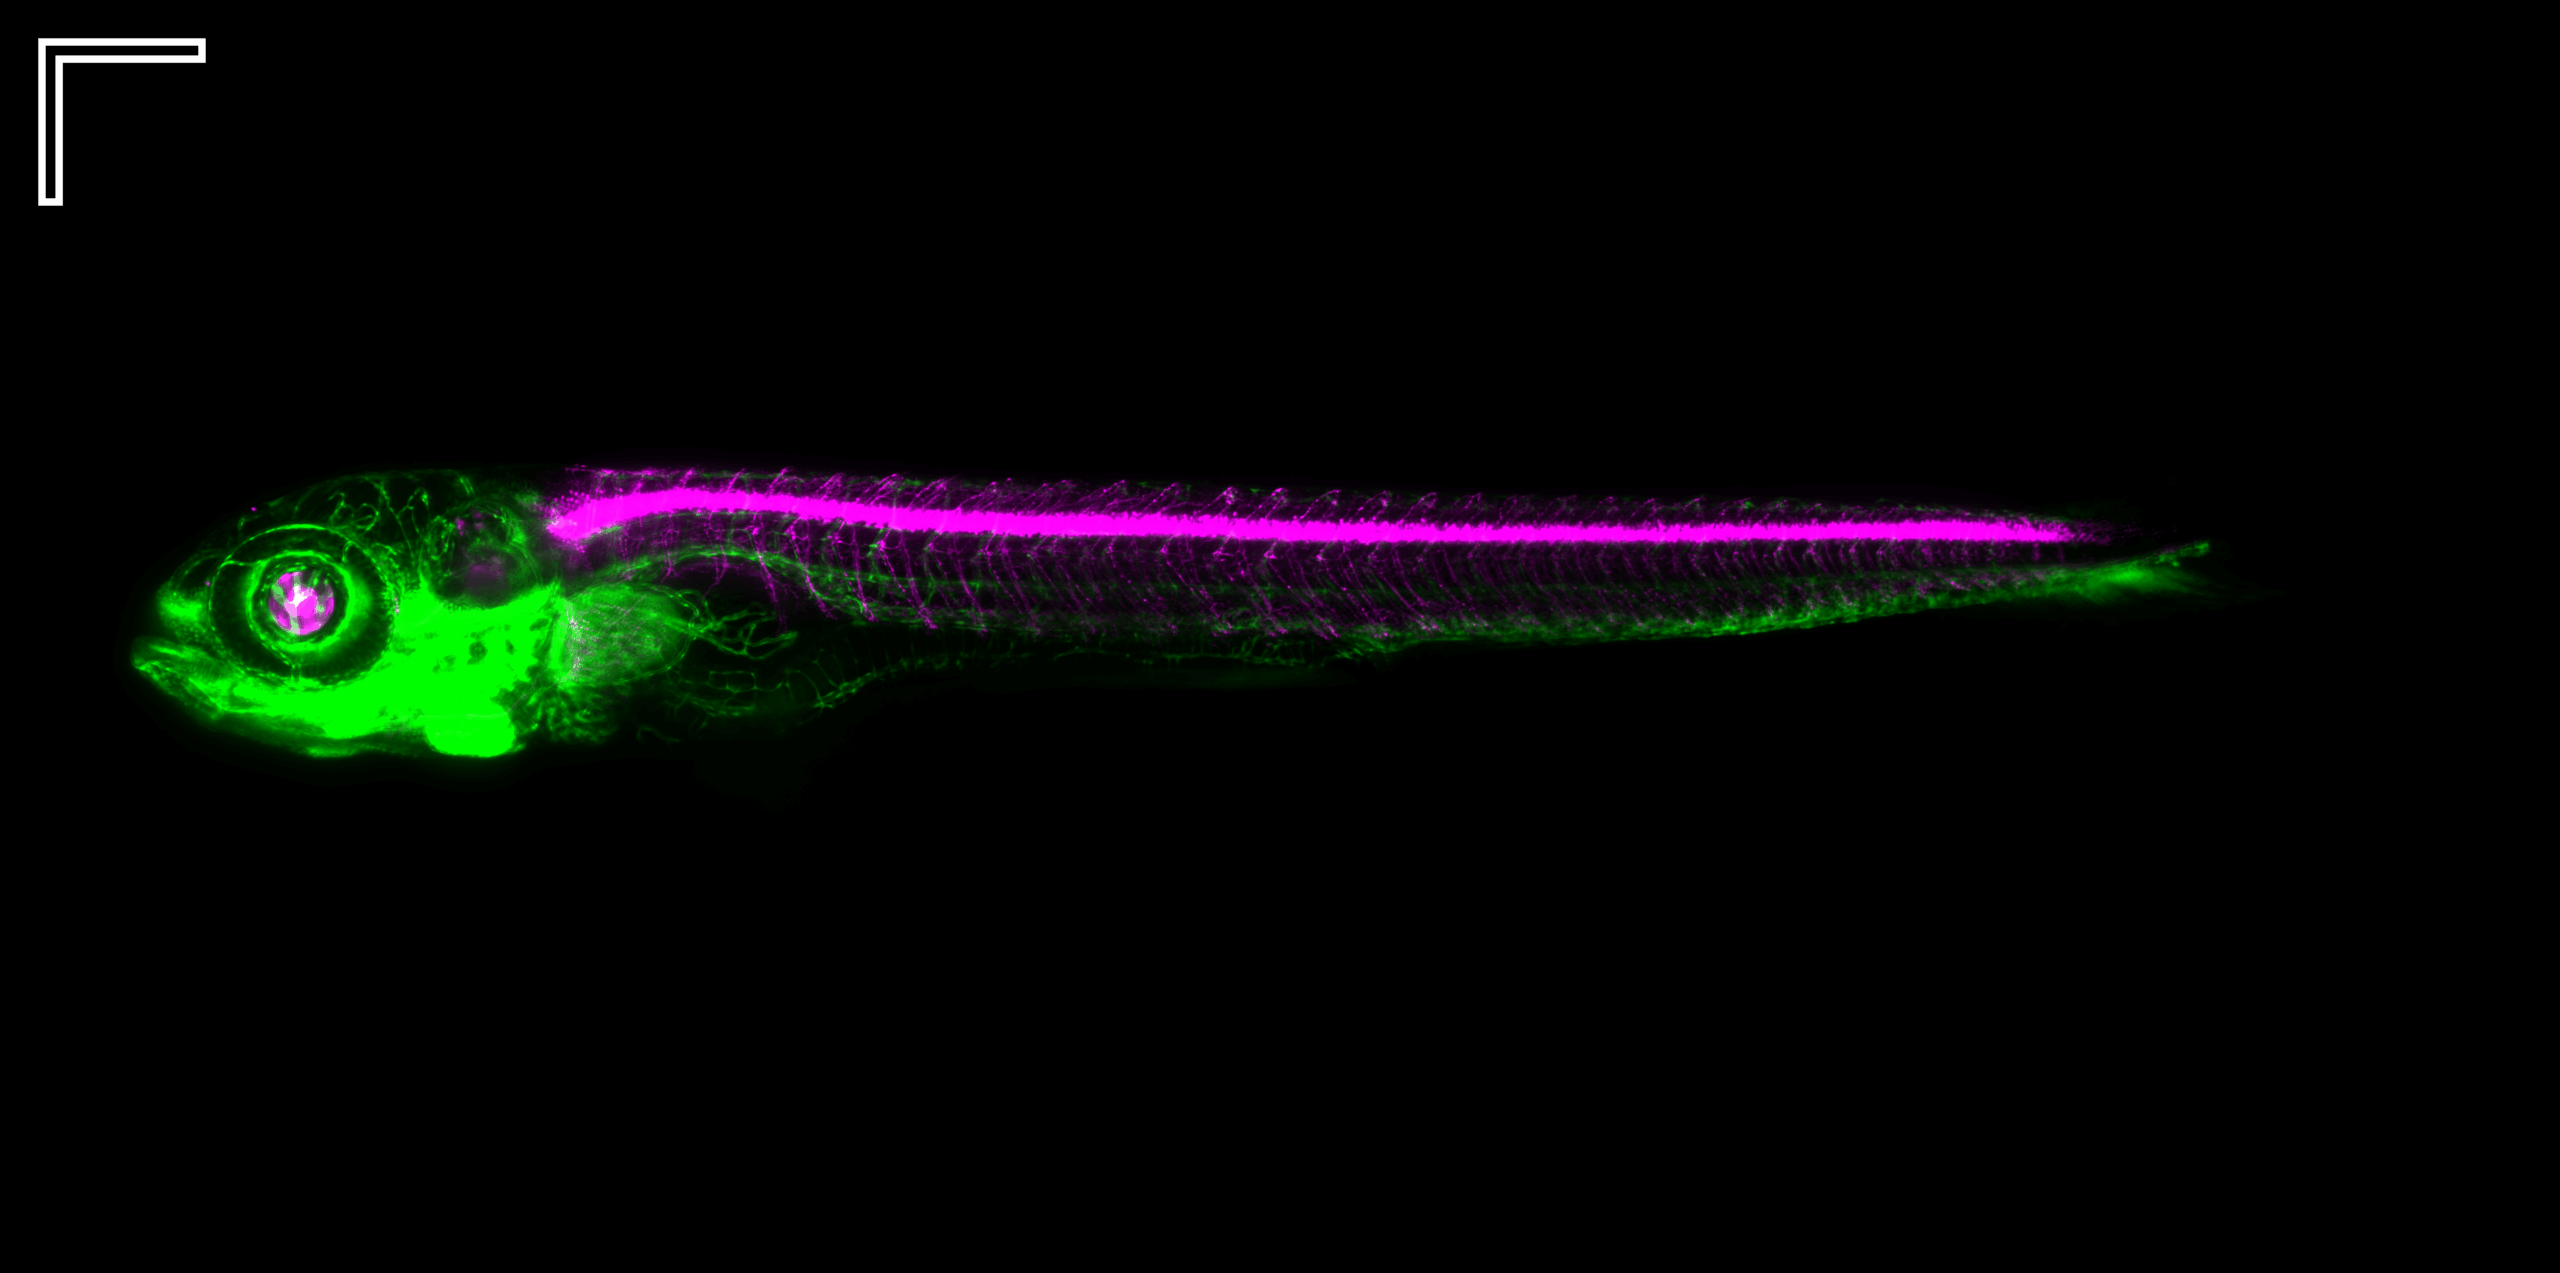
Blue, Red and Fish- Arlen Ramírez Corona
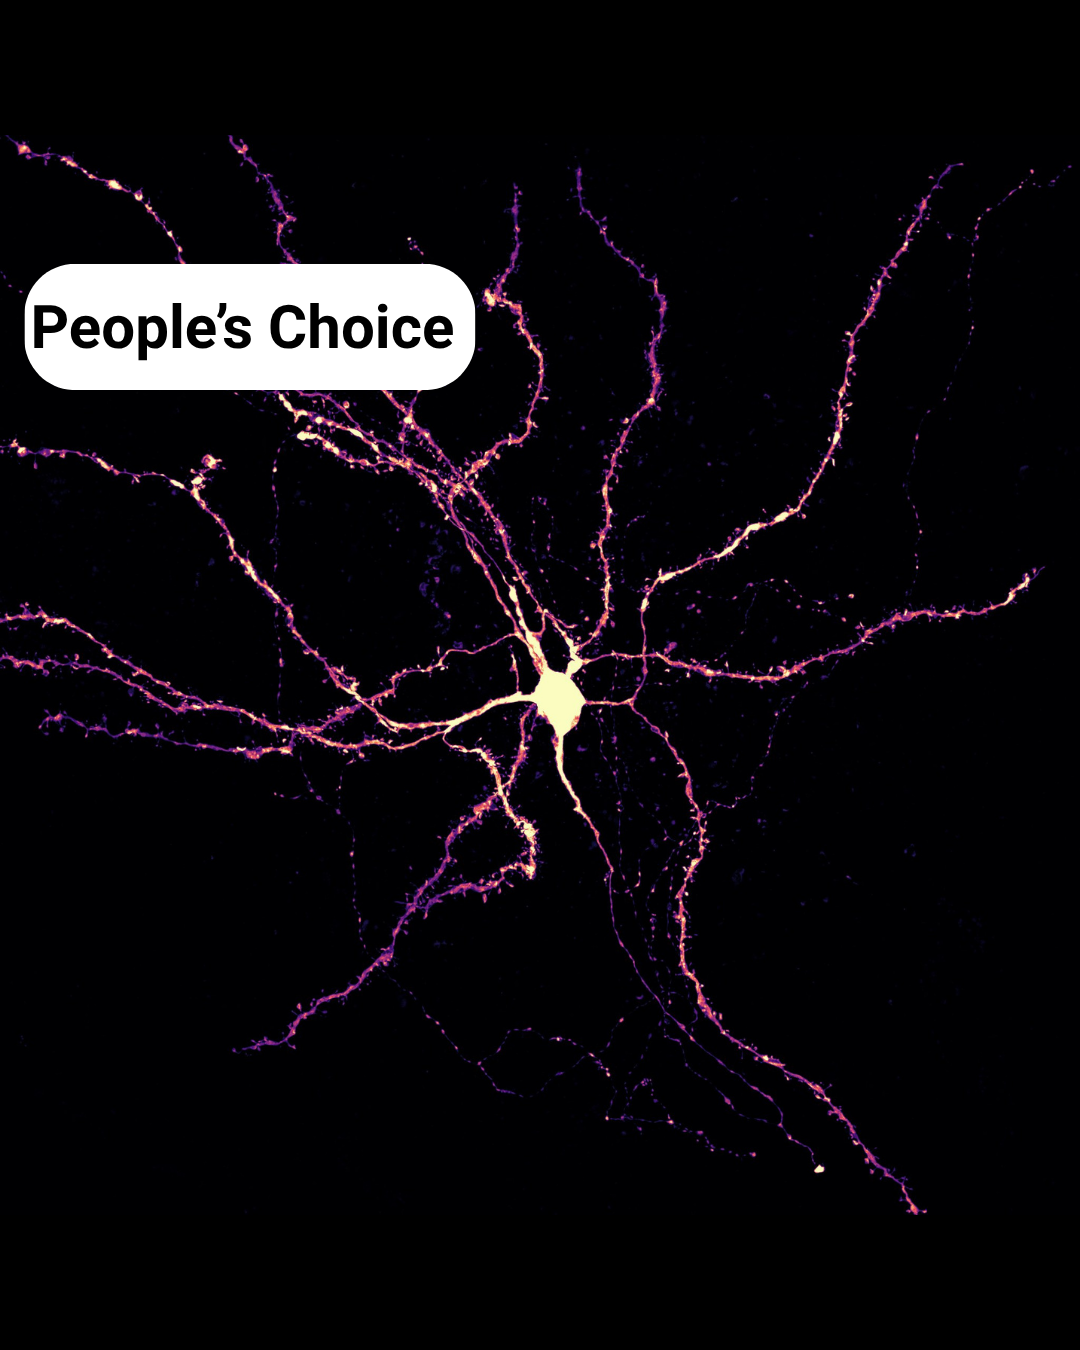
Dentritic constellation– Mahgol Darvishmolla
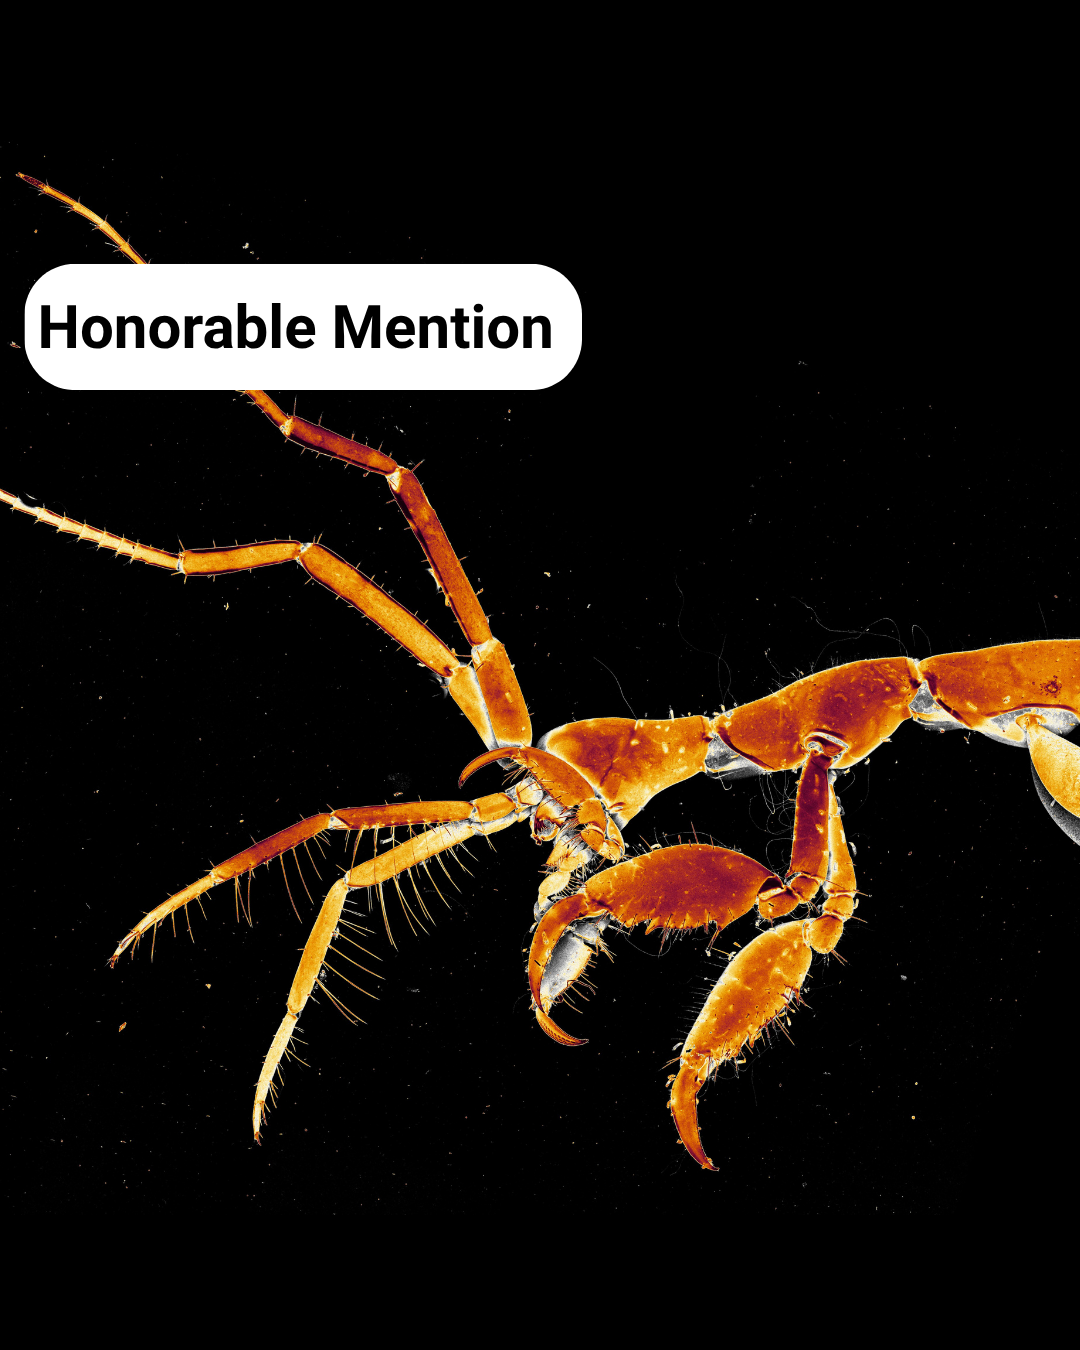
Textures of a Skeleton Shrimp– Caroline Hoppe

Mouse Kidney Disco- Chetan Poudel
The Kidney Landscape– Meriam Shabbar
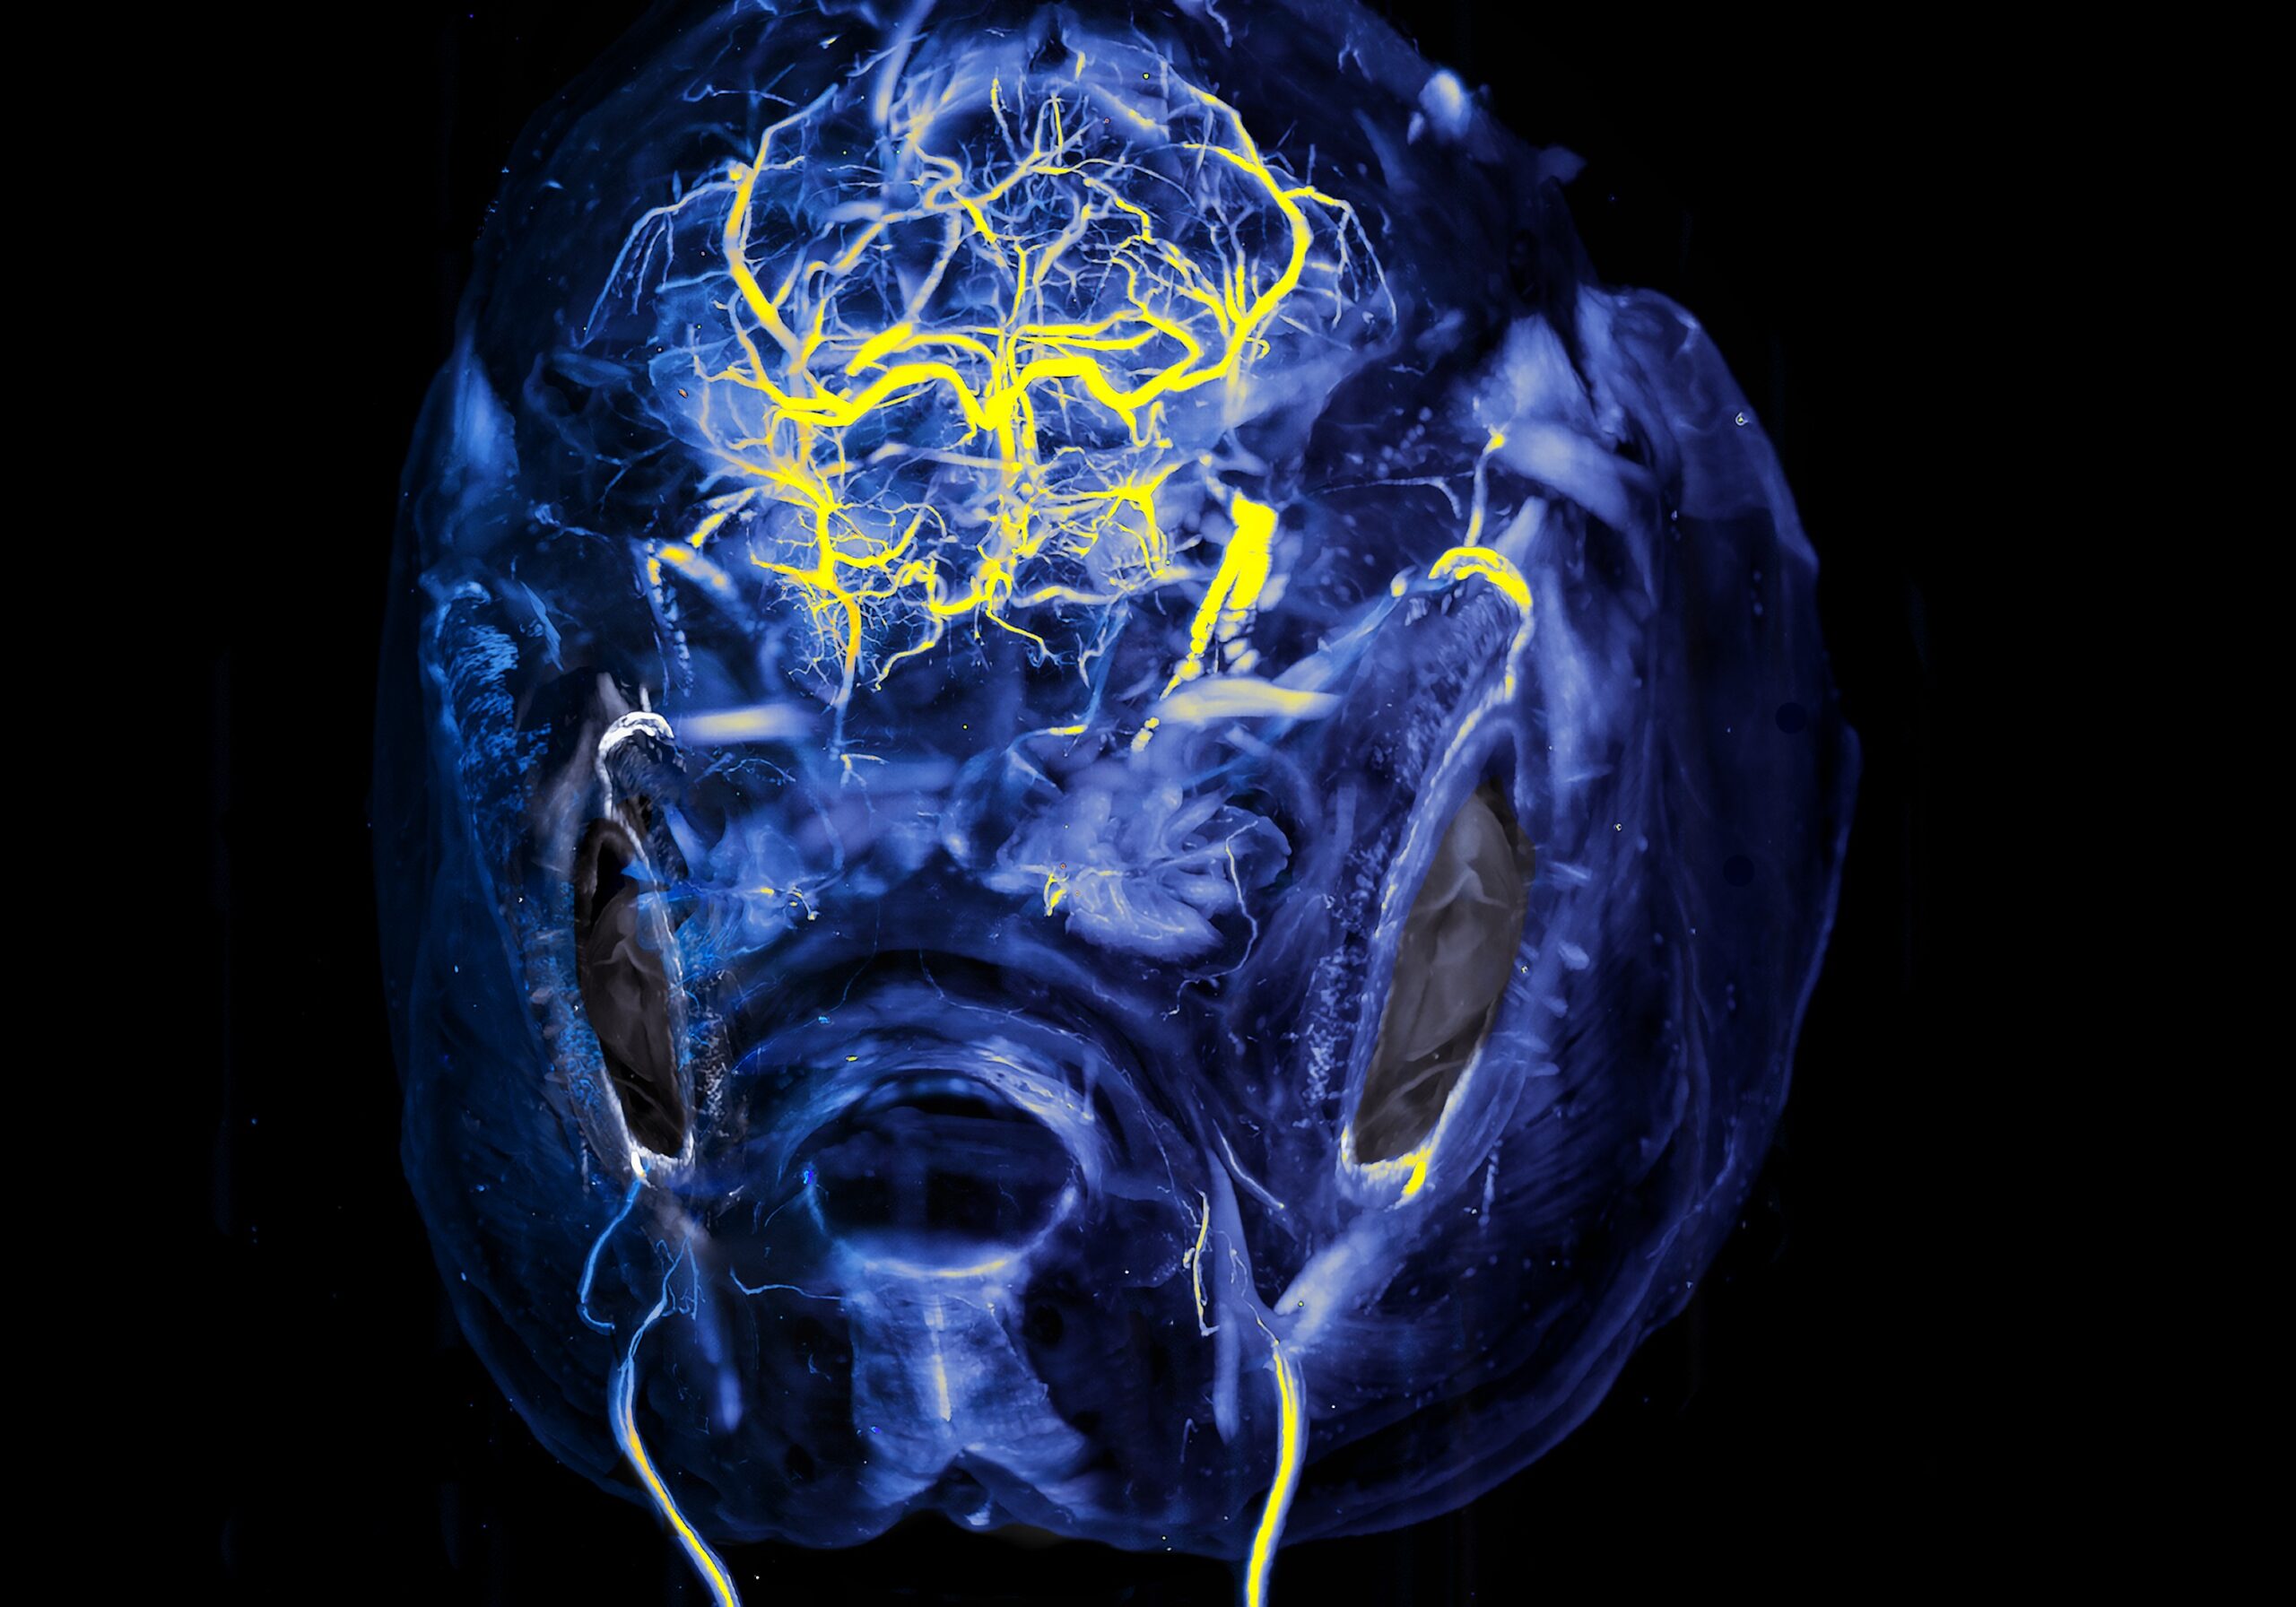
Fish on the Brain- Hannah Somers
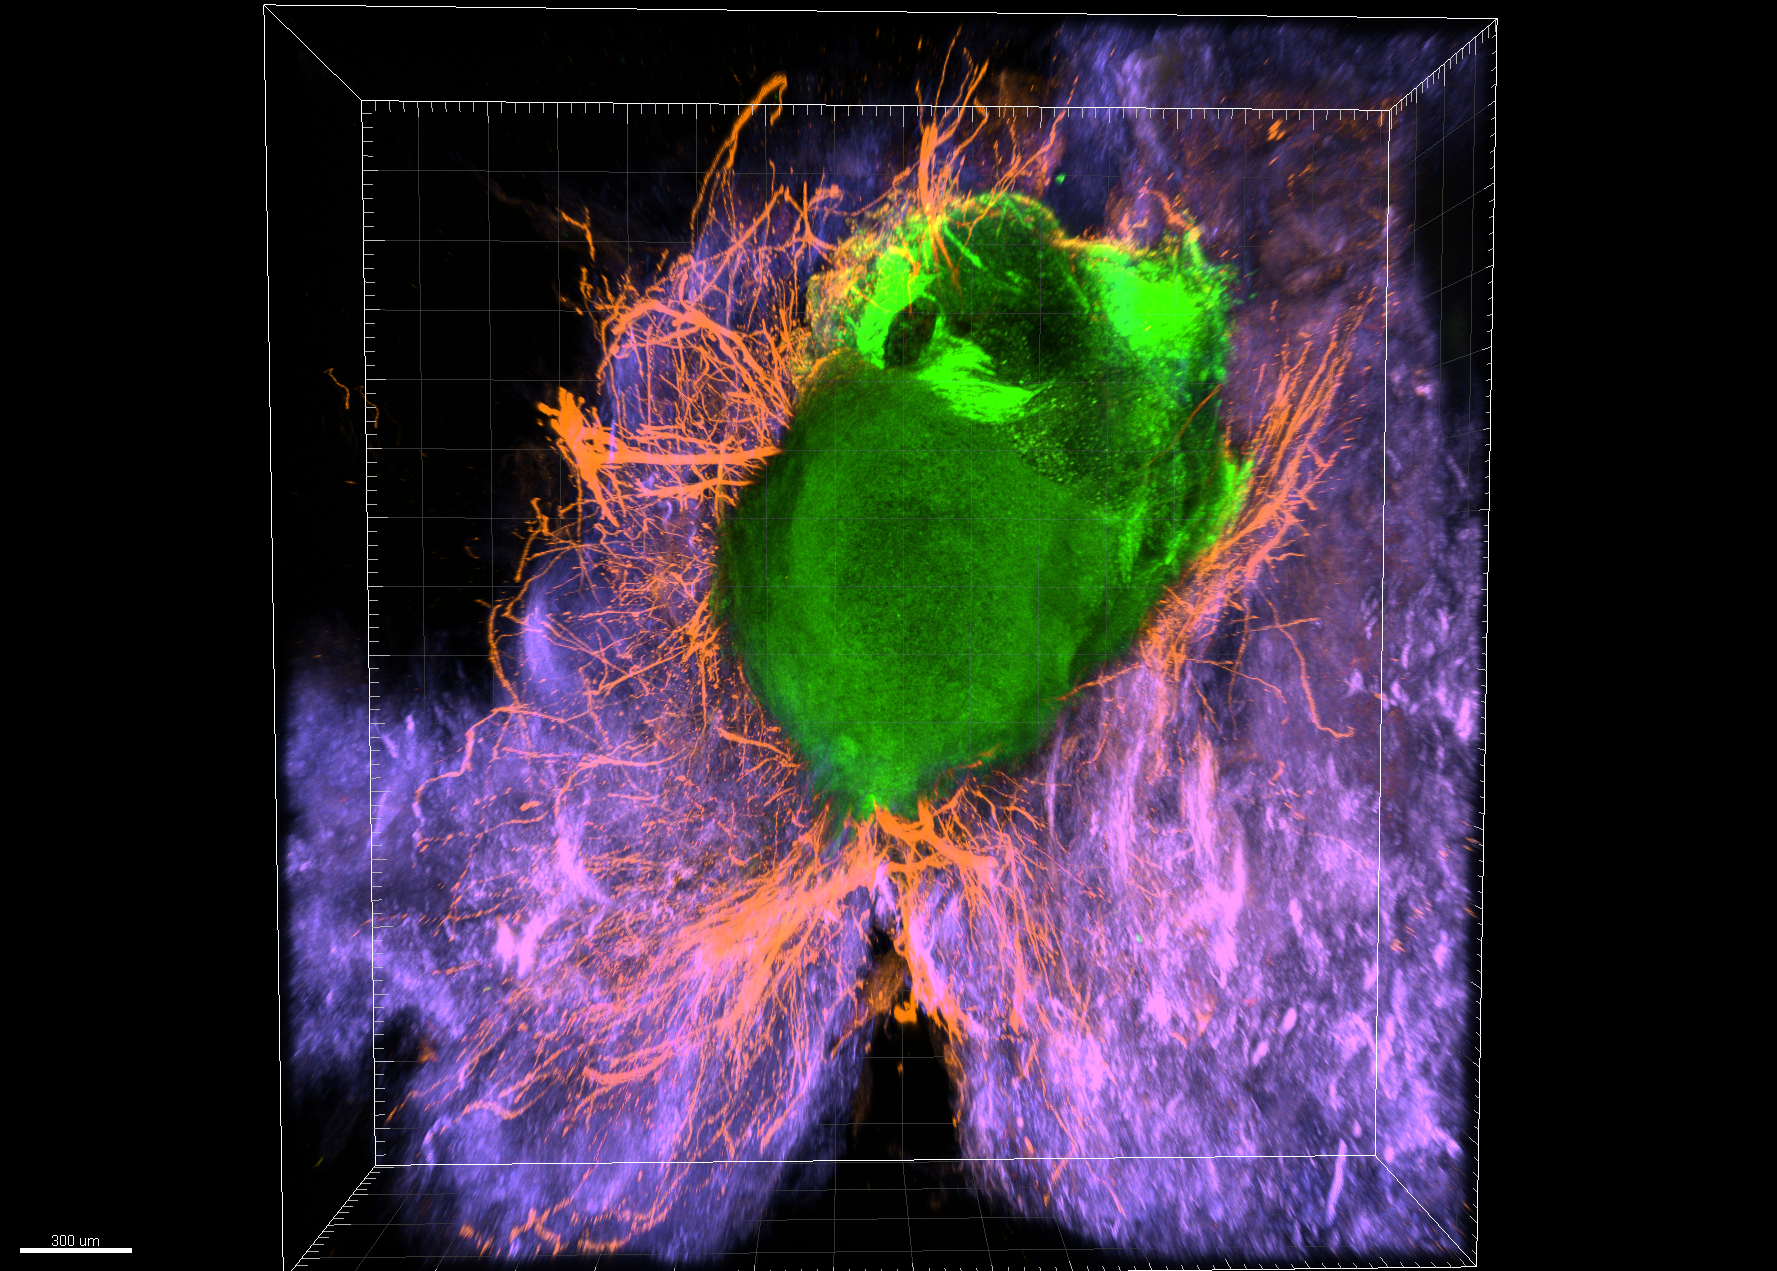
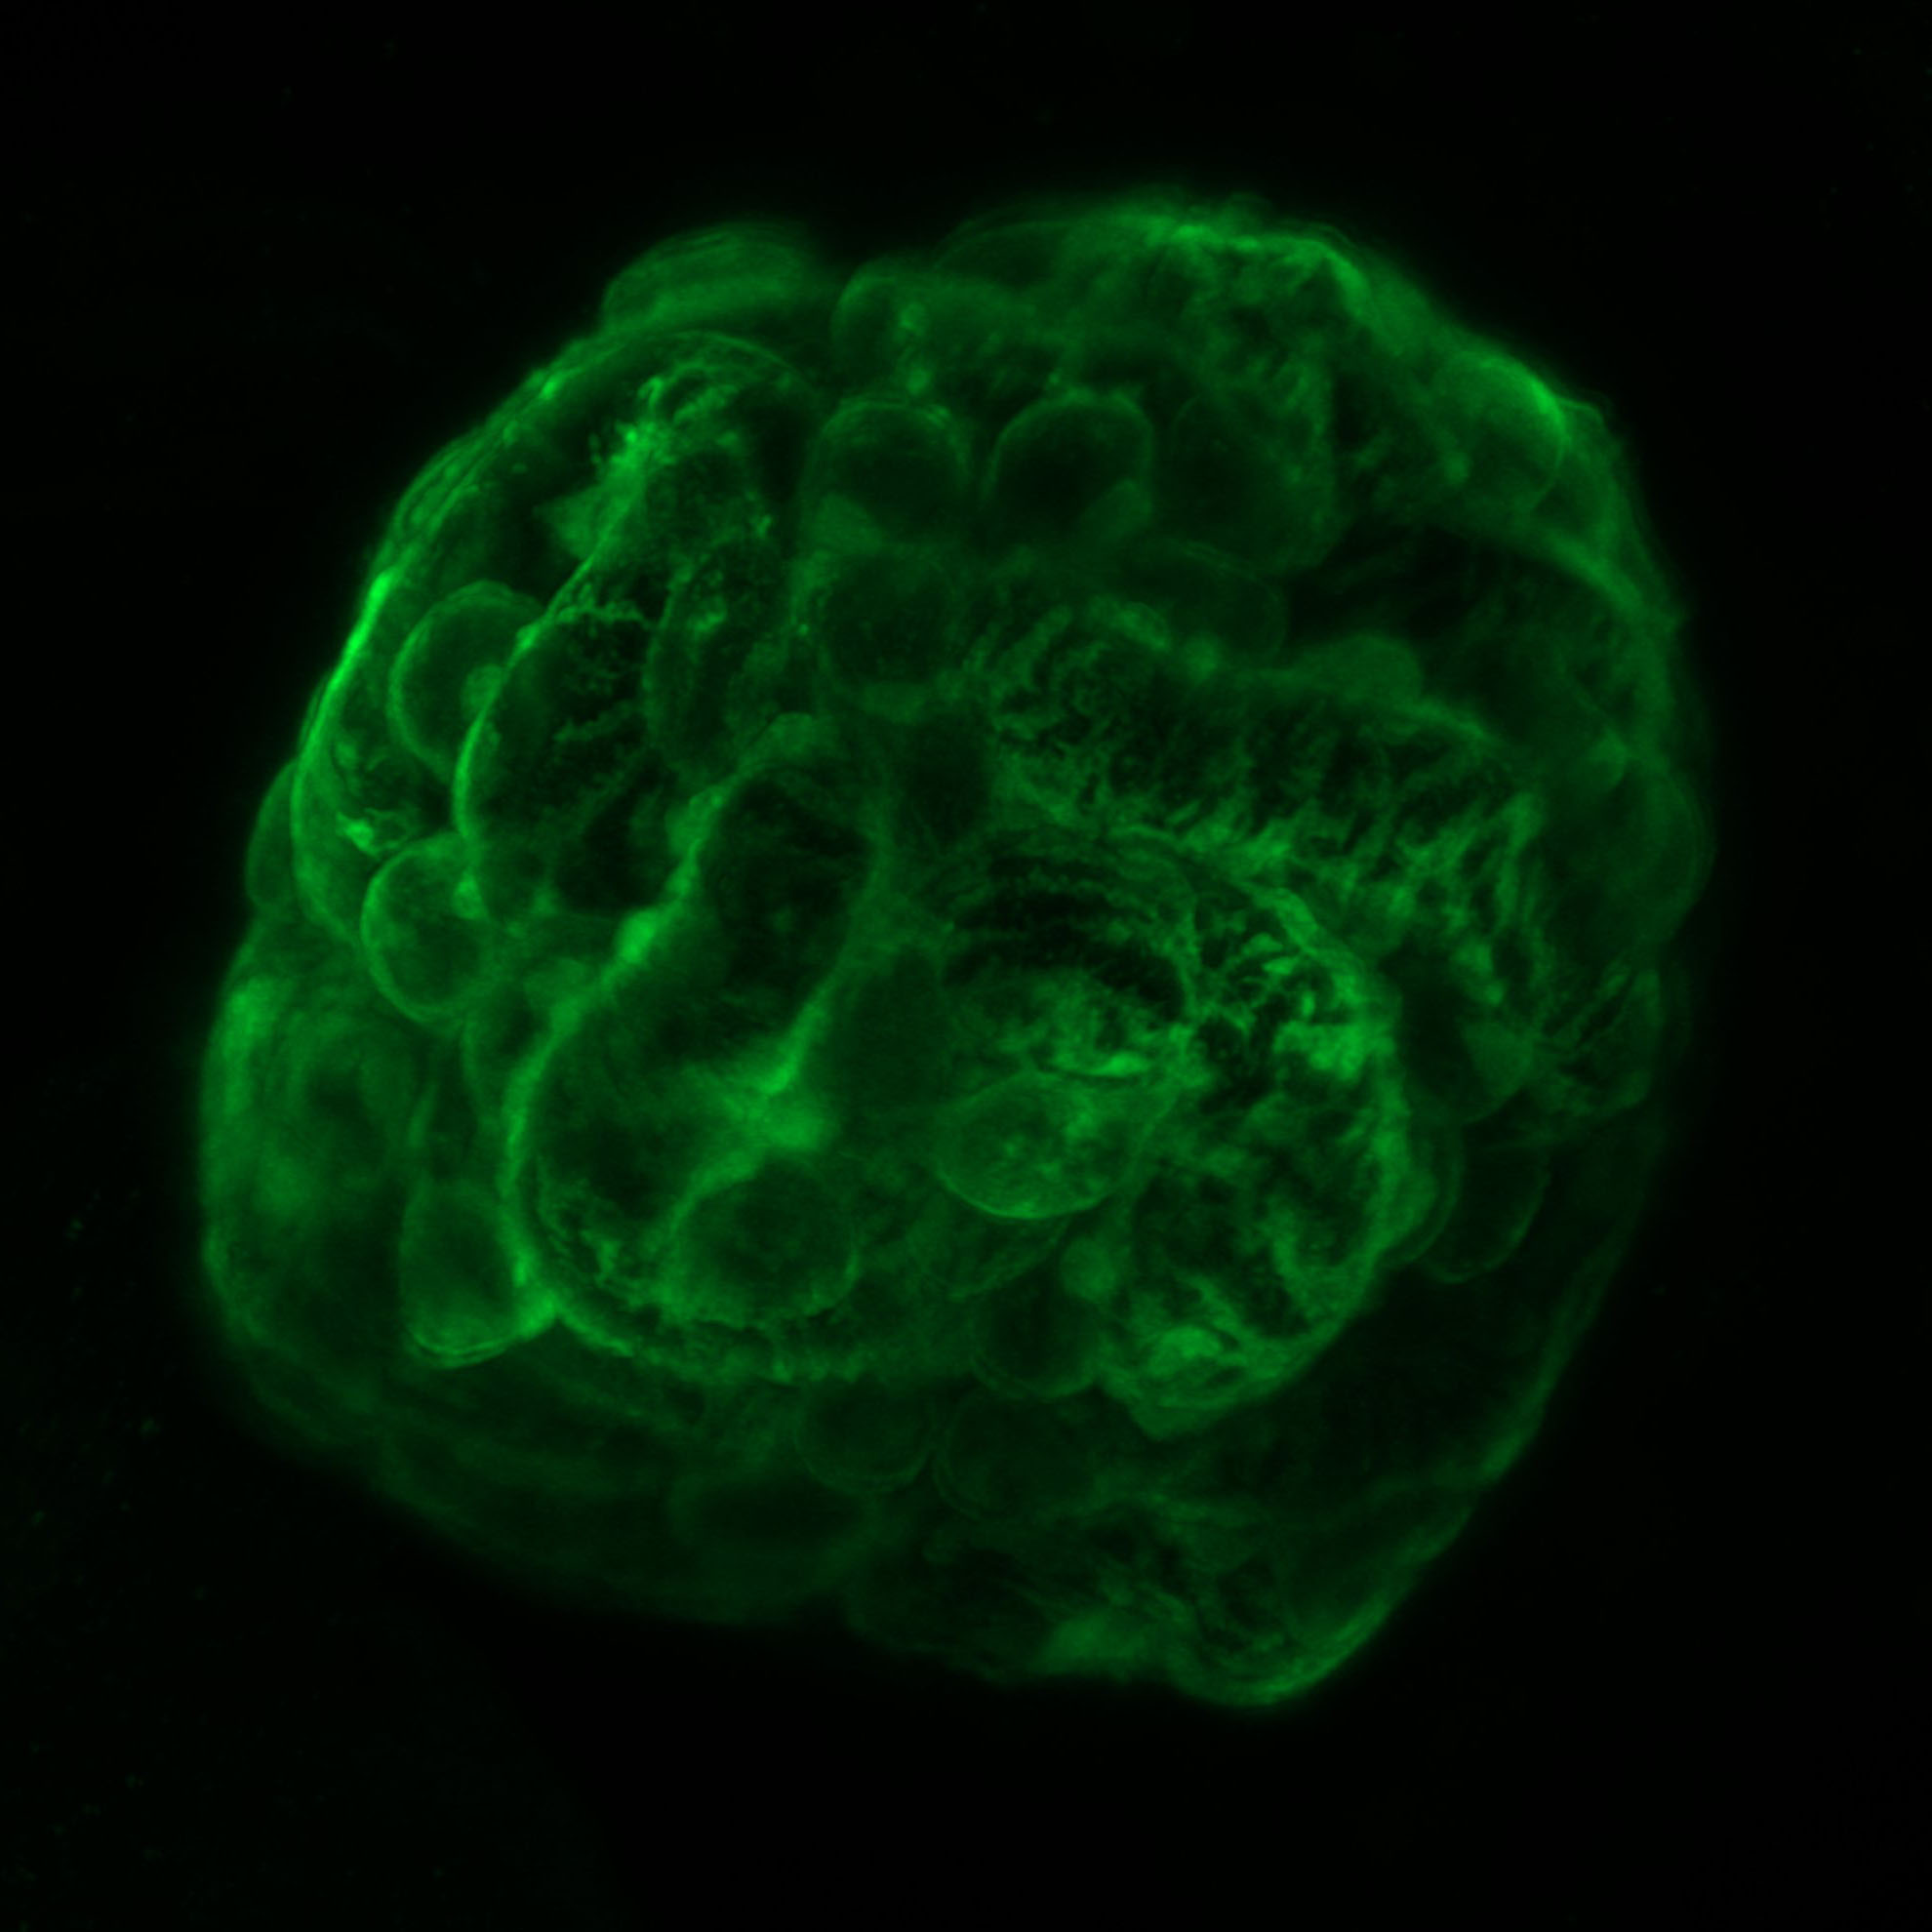
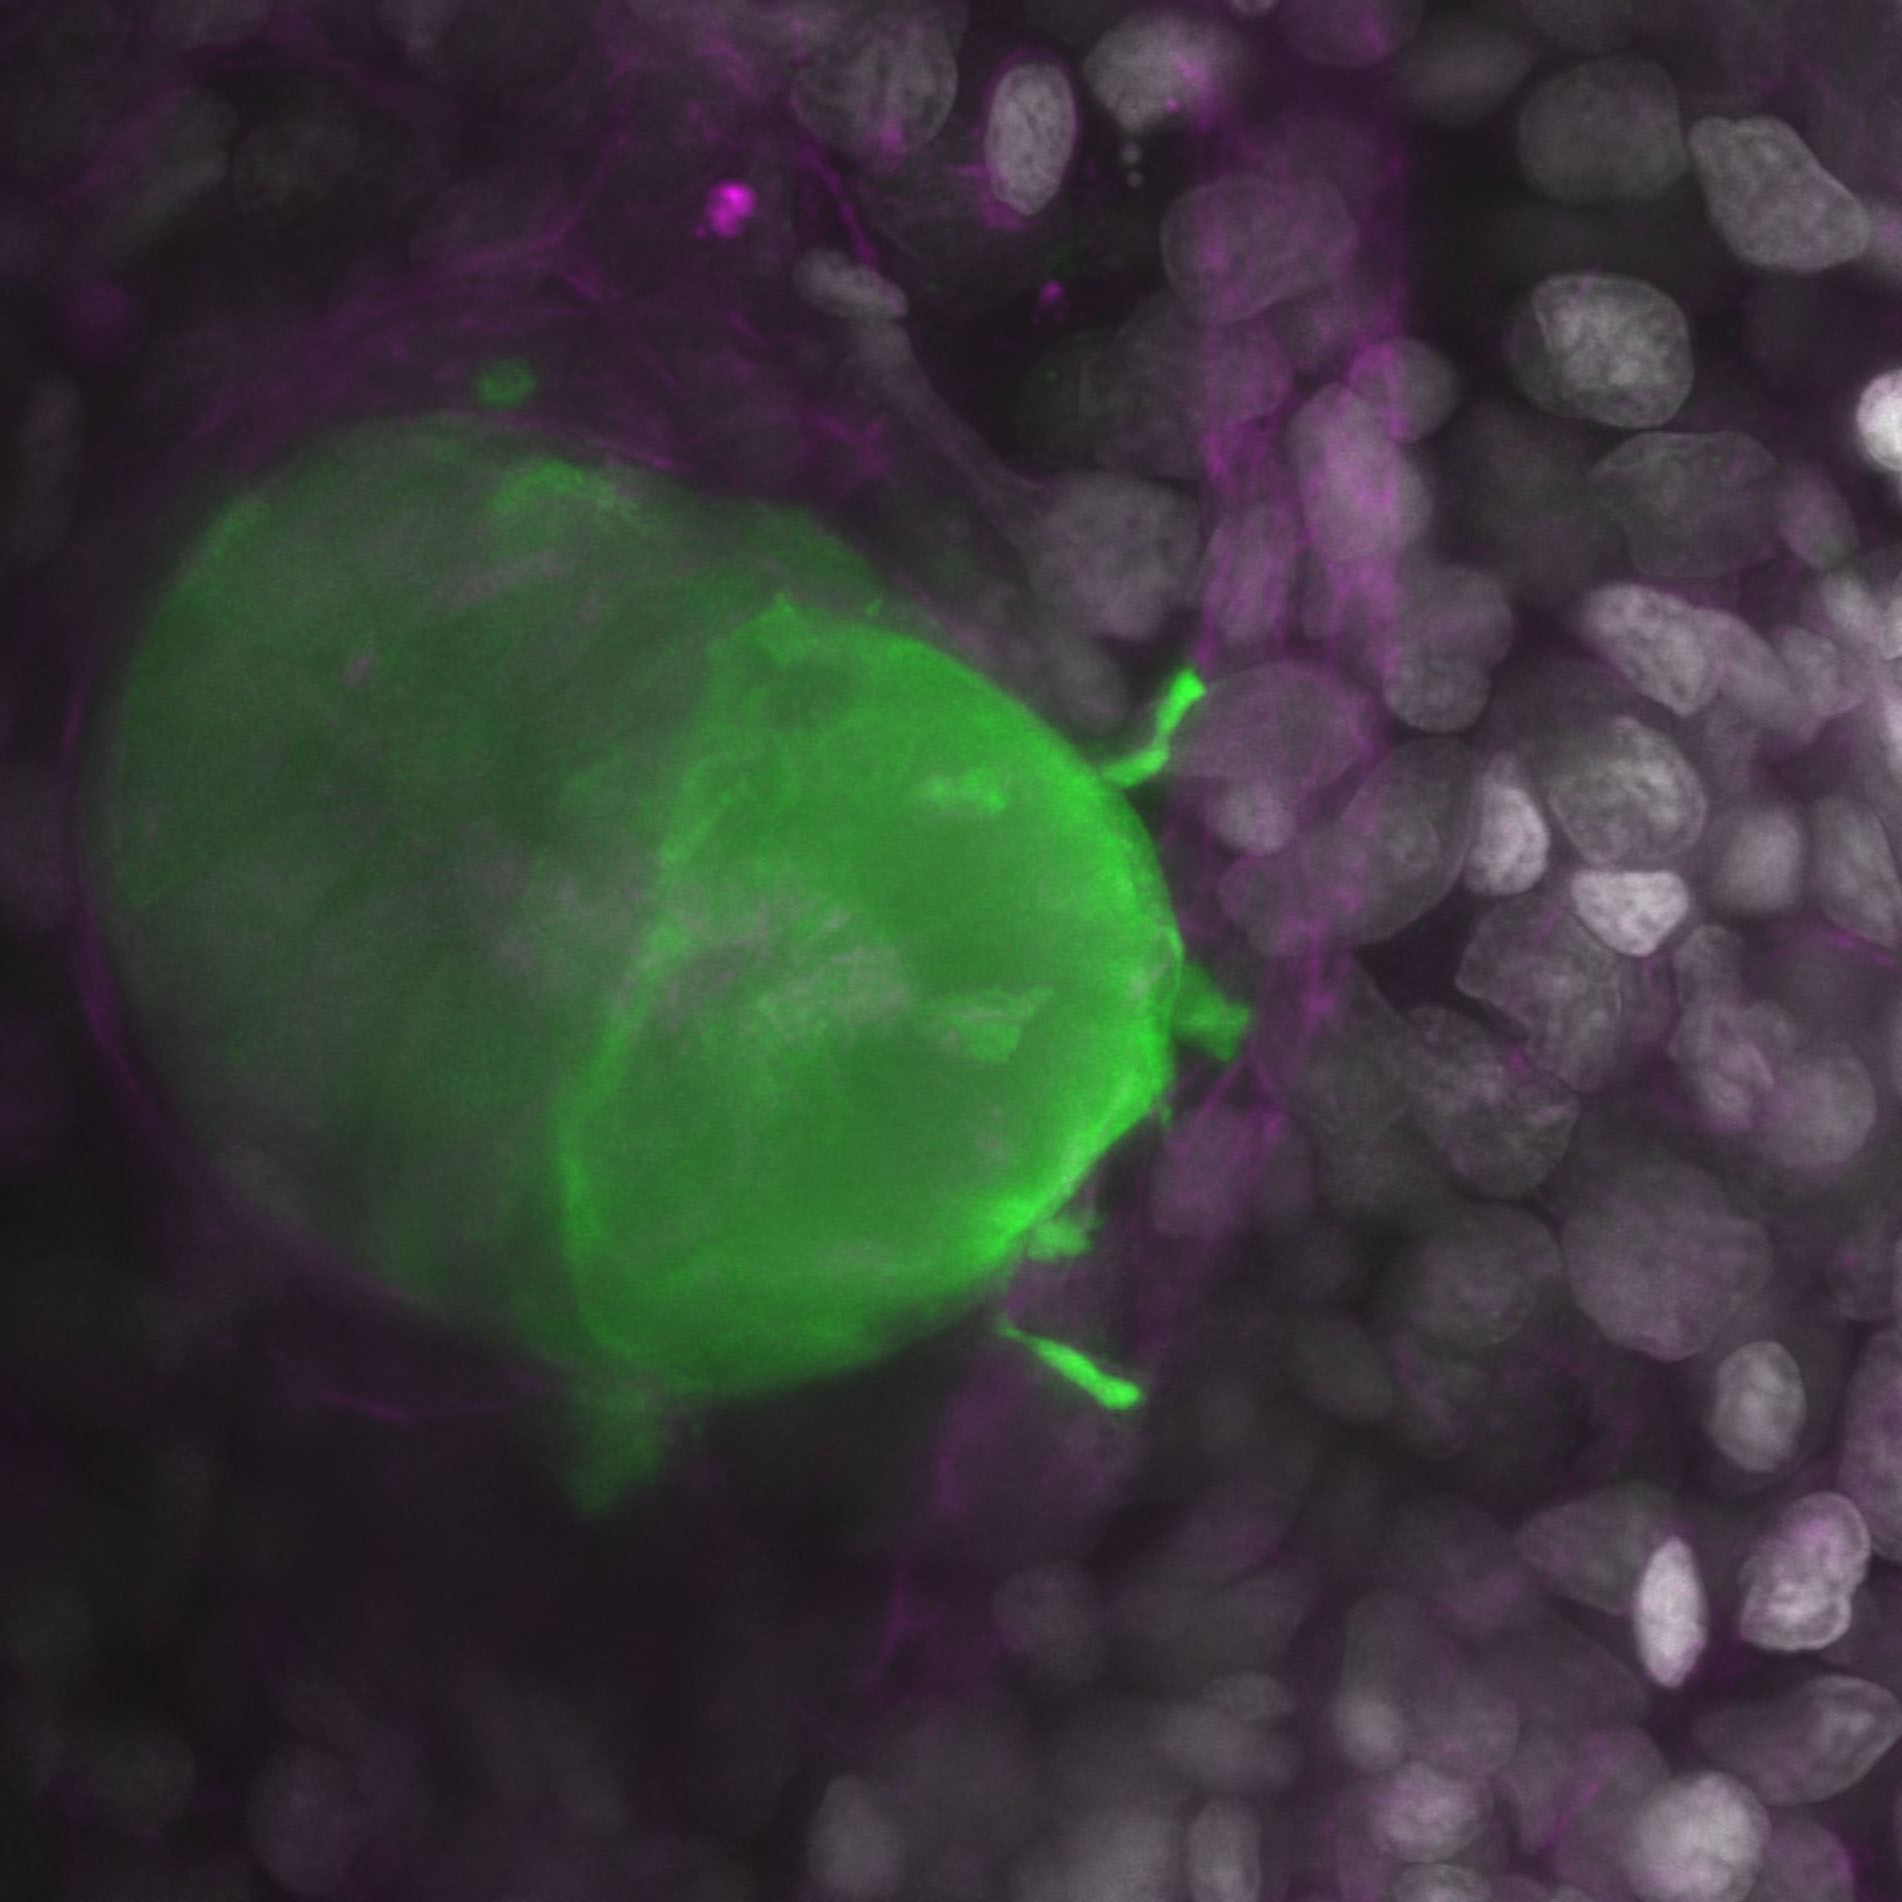
Cortical Organoid in a Bioactive Scaffold– Oscar Carballo-Molina
Brain time– Ian Davis
Forest of Memory- Philipp Velicky
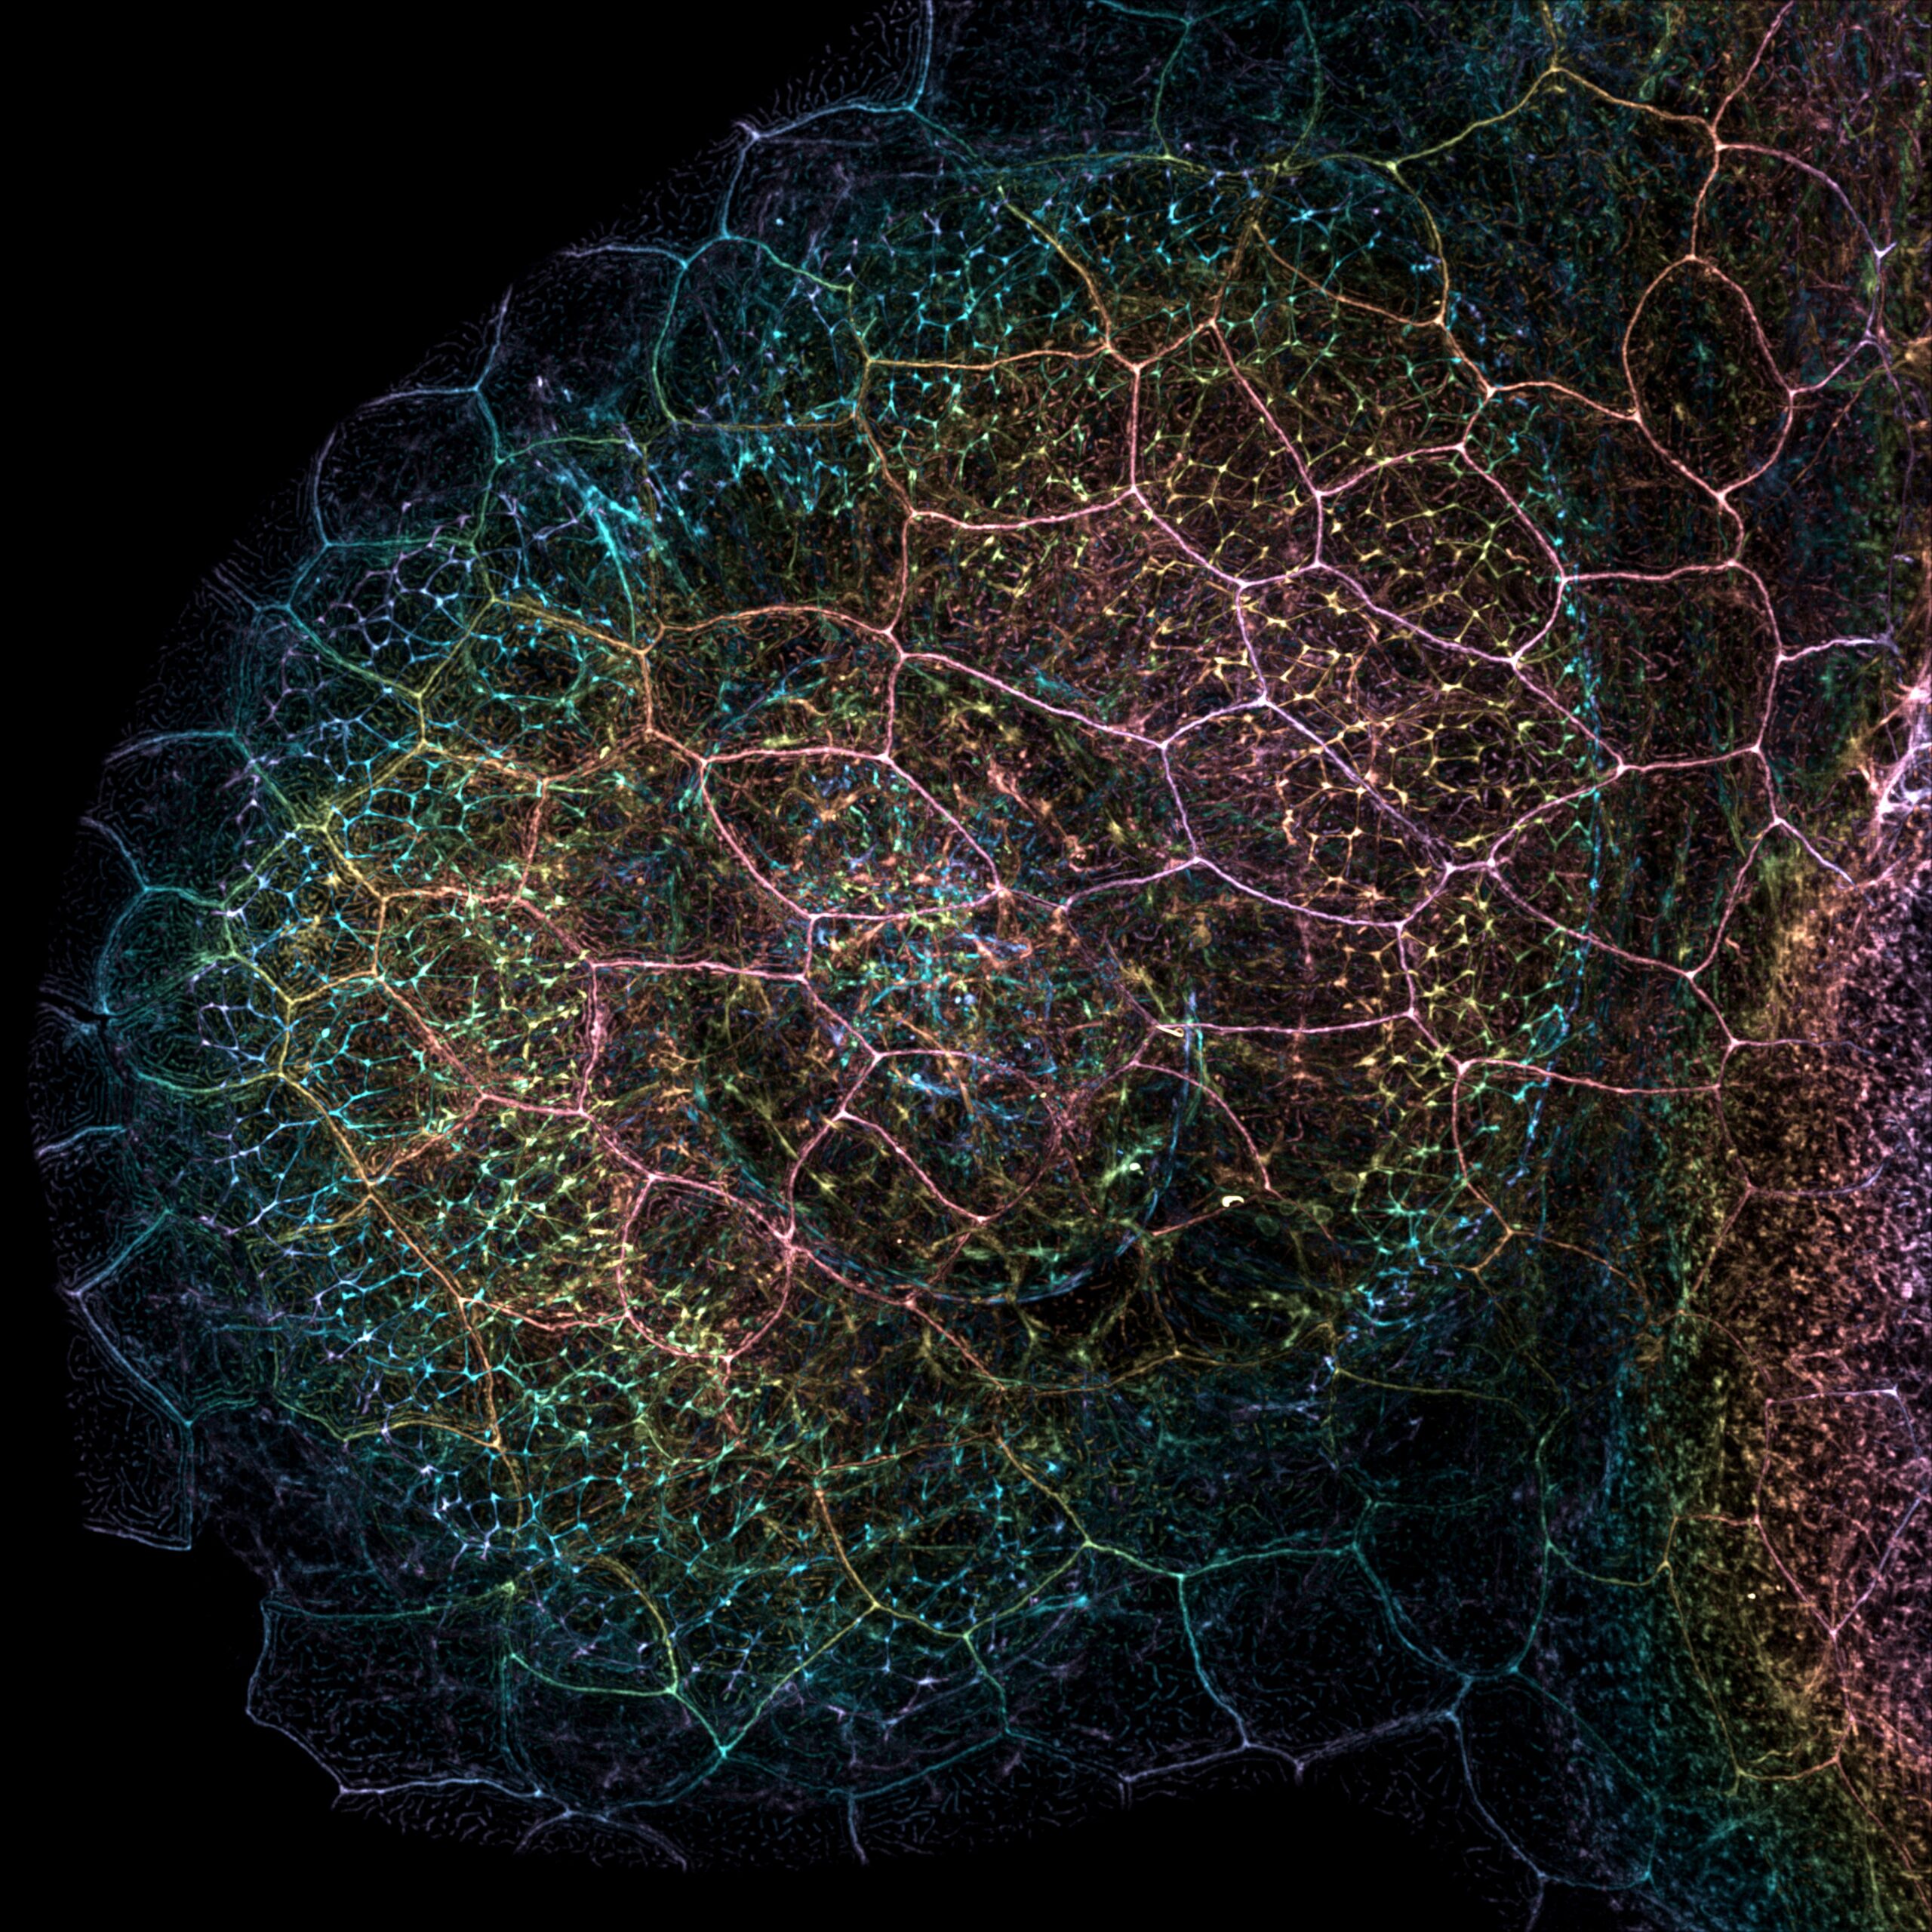
Cobblestone pathway – Team: Mariana De Niz, Jocelyn Salvador, Luisa Iruela-Arispe
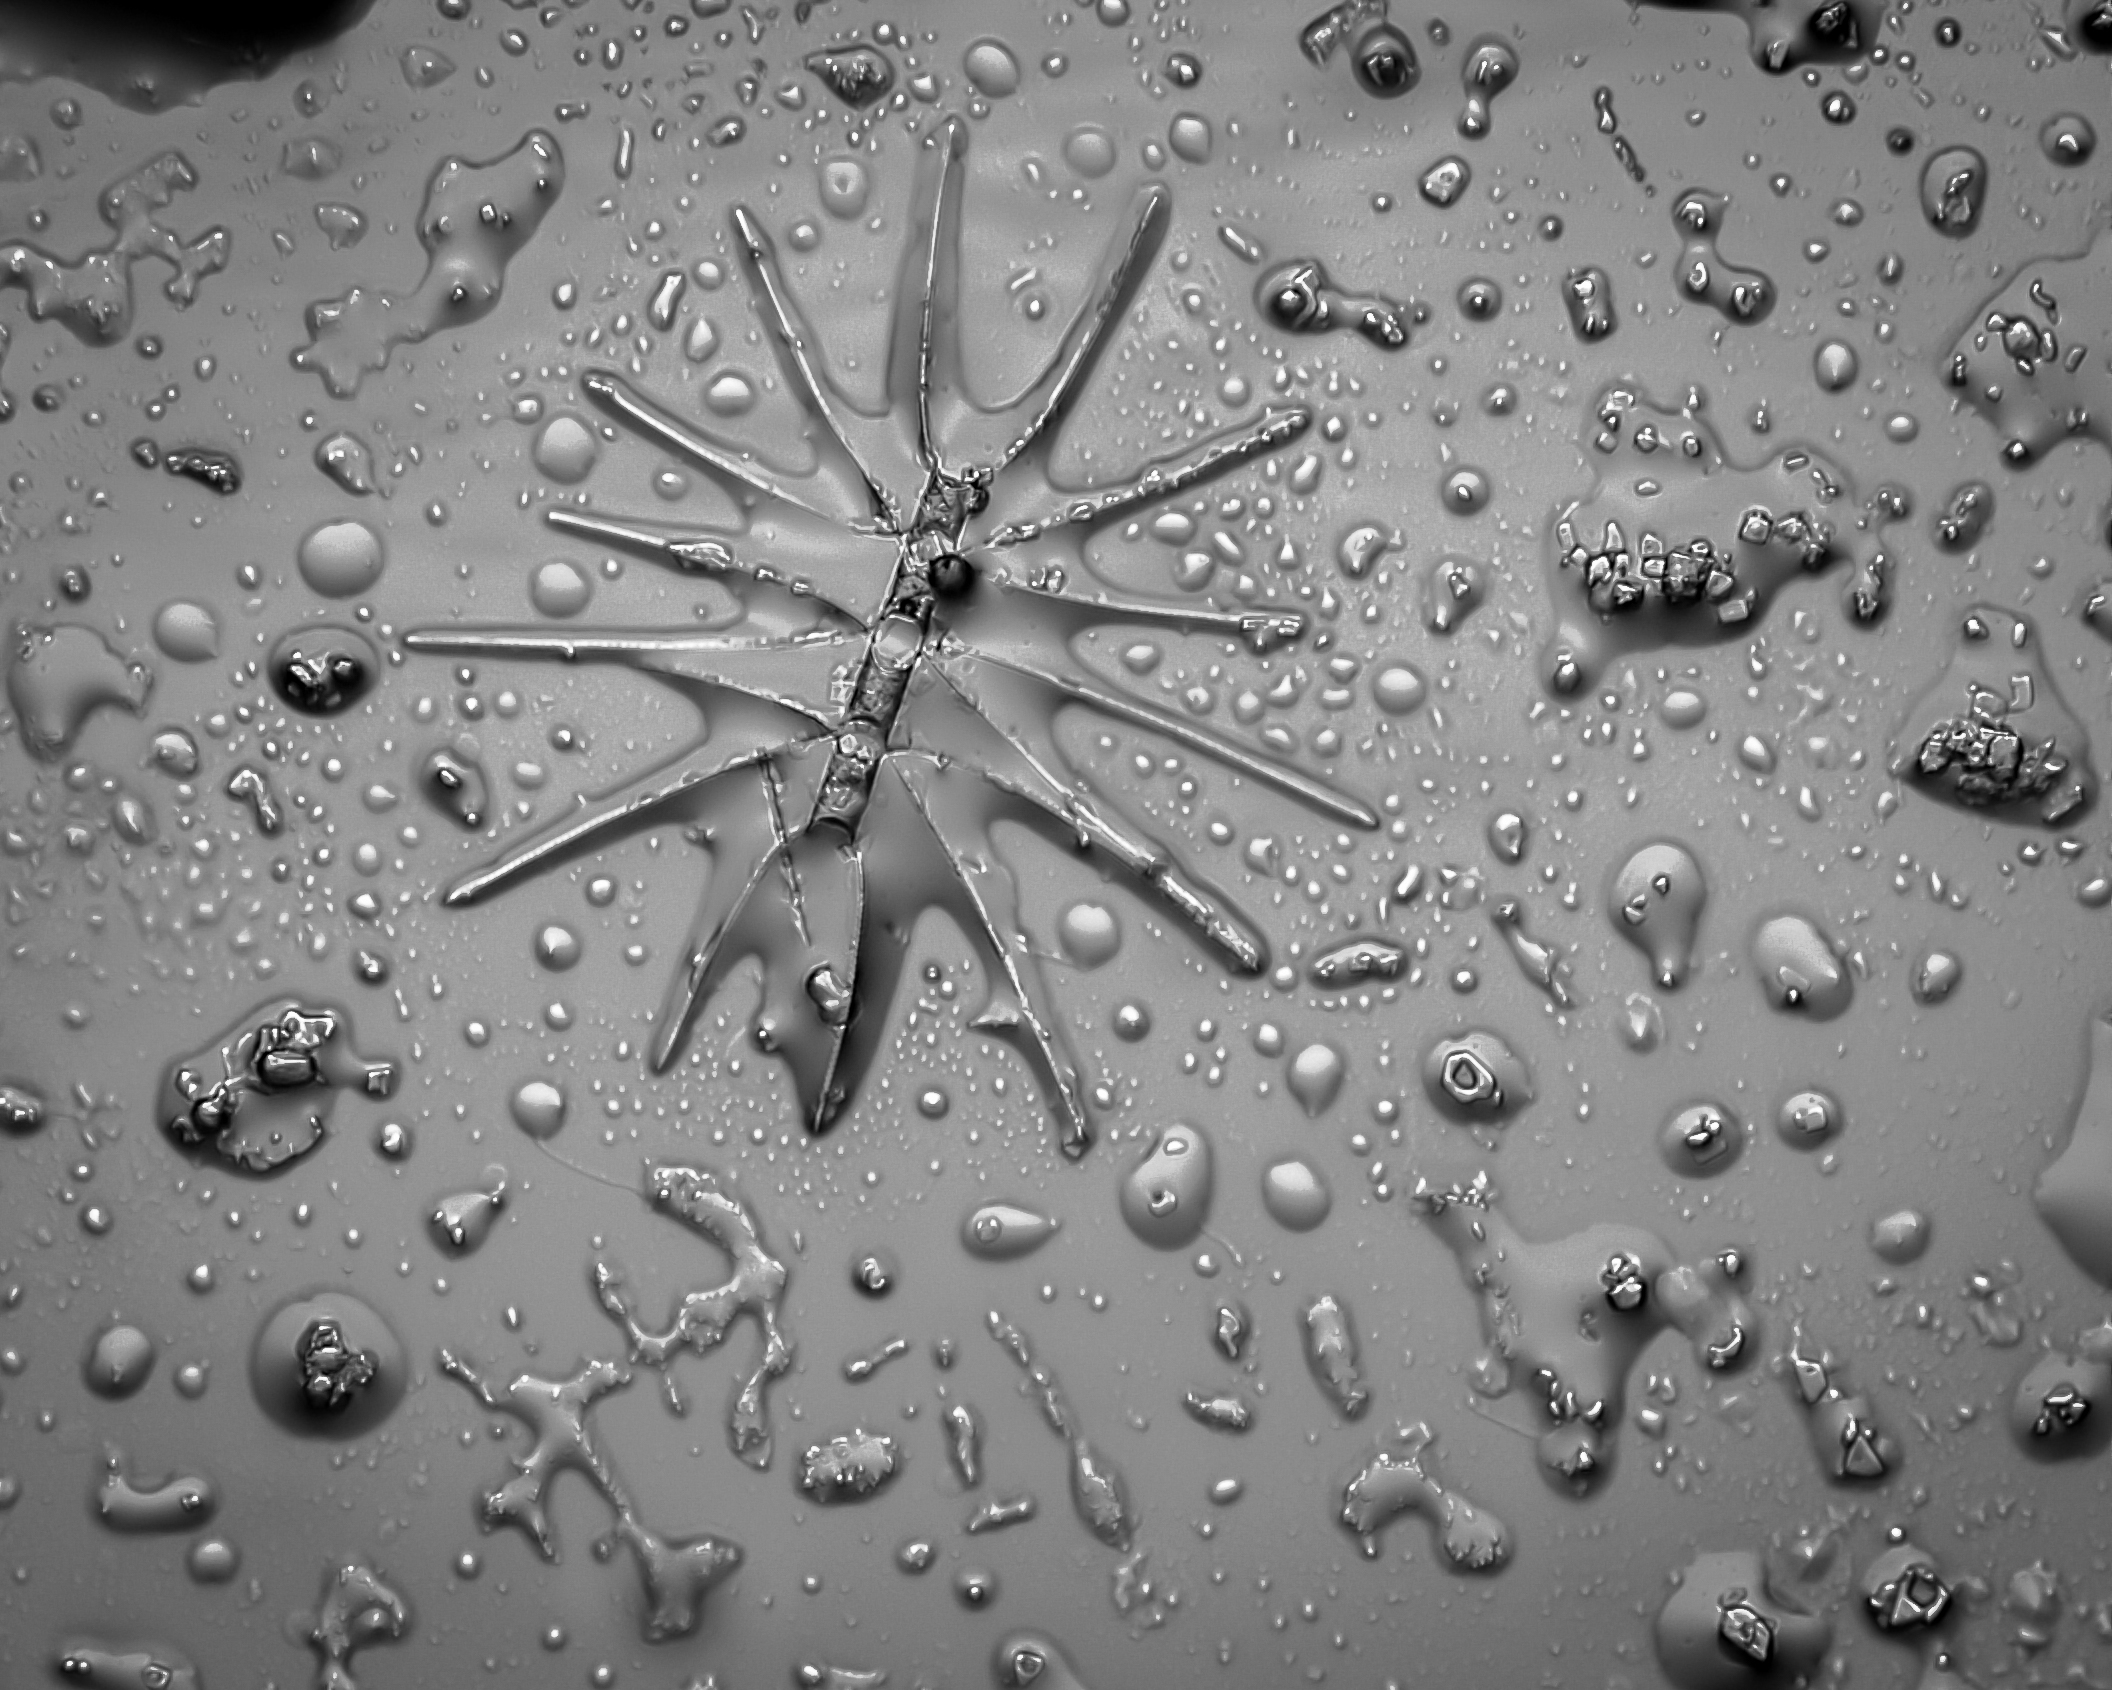
A Starburst of Cellular Life– Sooraj Siini
diatom –Jose Manuel Martinez Lopez
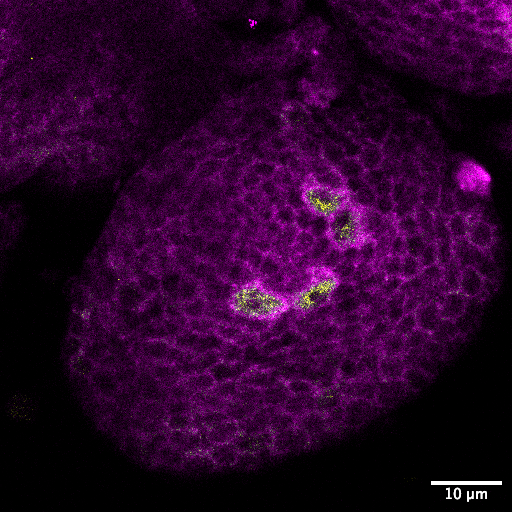
Mushroombody Neuroblasts: Ribosomal Powerhouses of the Fly Brain– Kranti Meher
Frozen in Motion– Caroline Hoppe
When too much is too much (power)! – Martina Giampetraglia
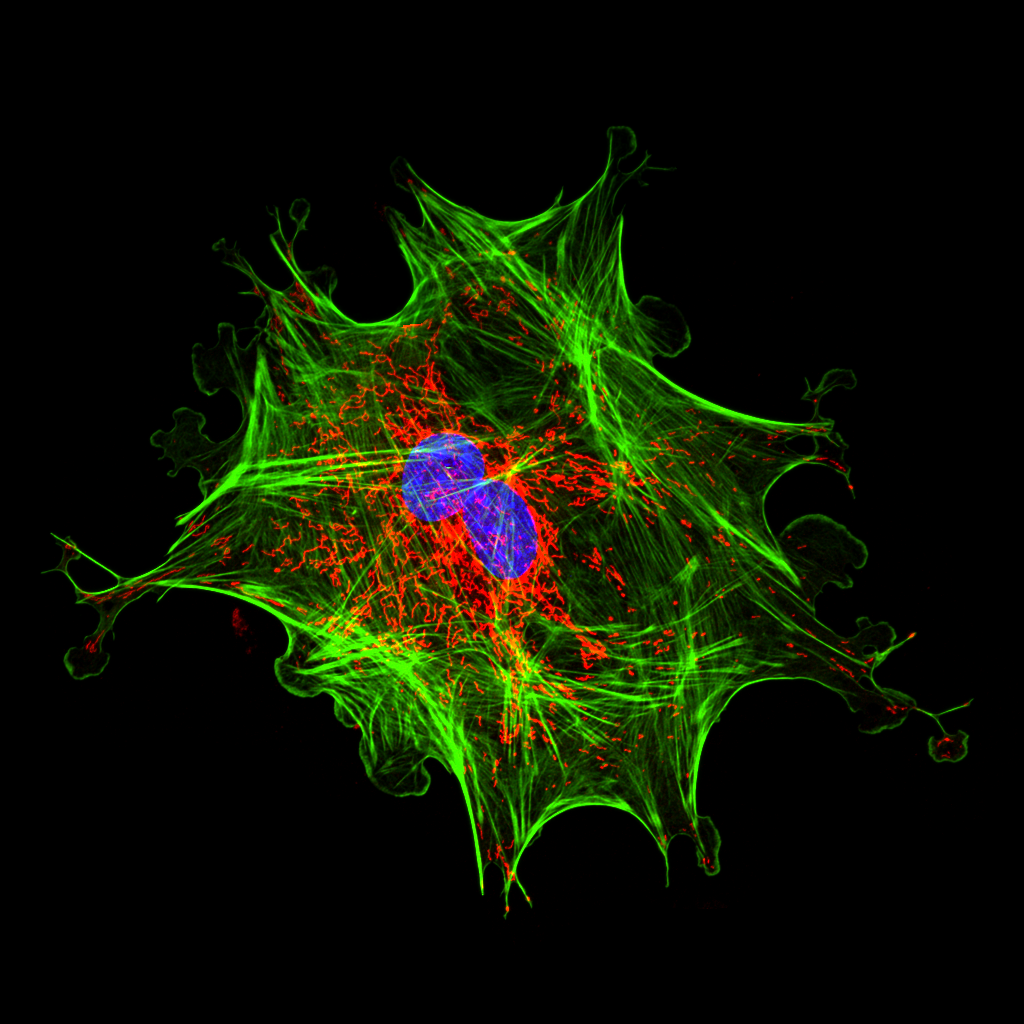
Snapshot of Cells Working to Heal A Wound- Ji Hong Sayo
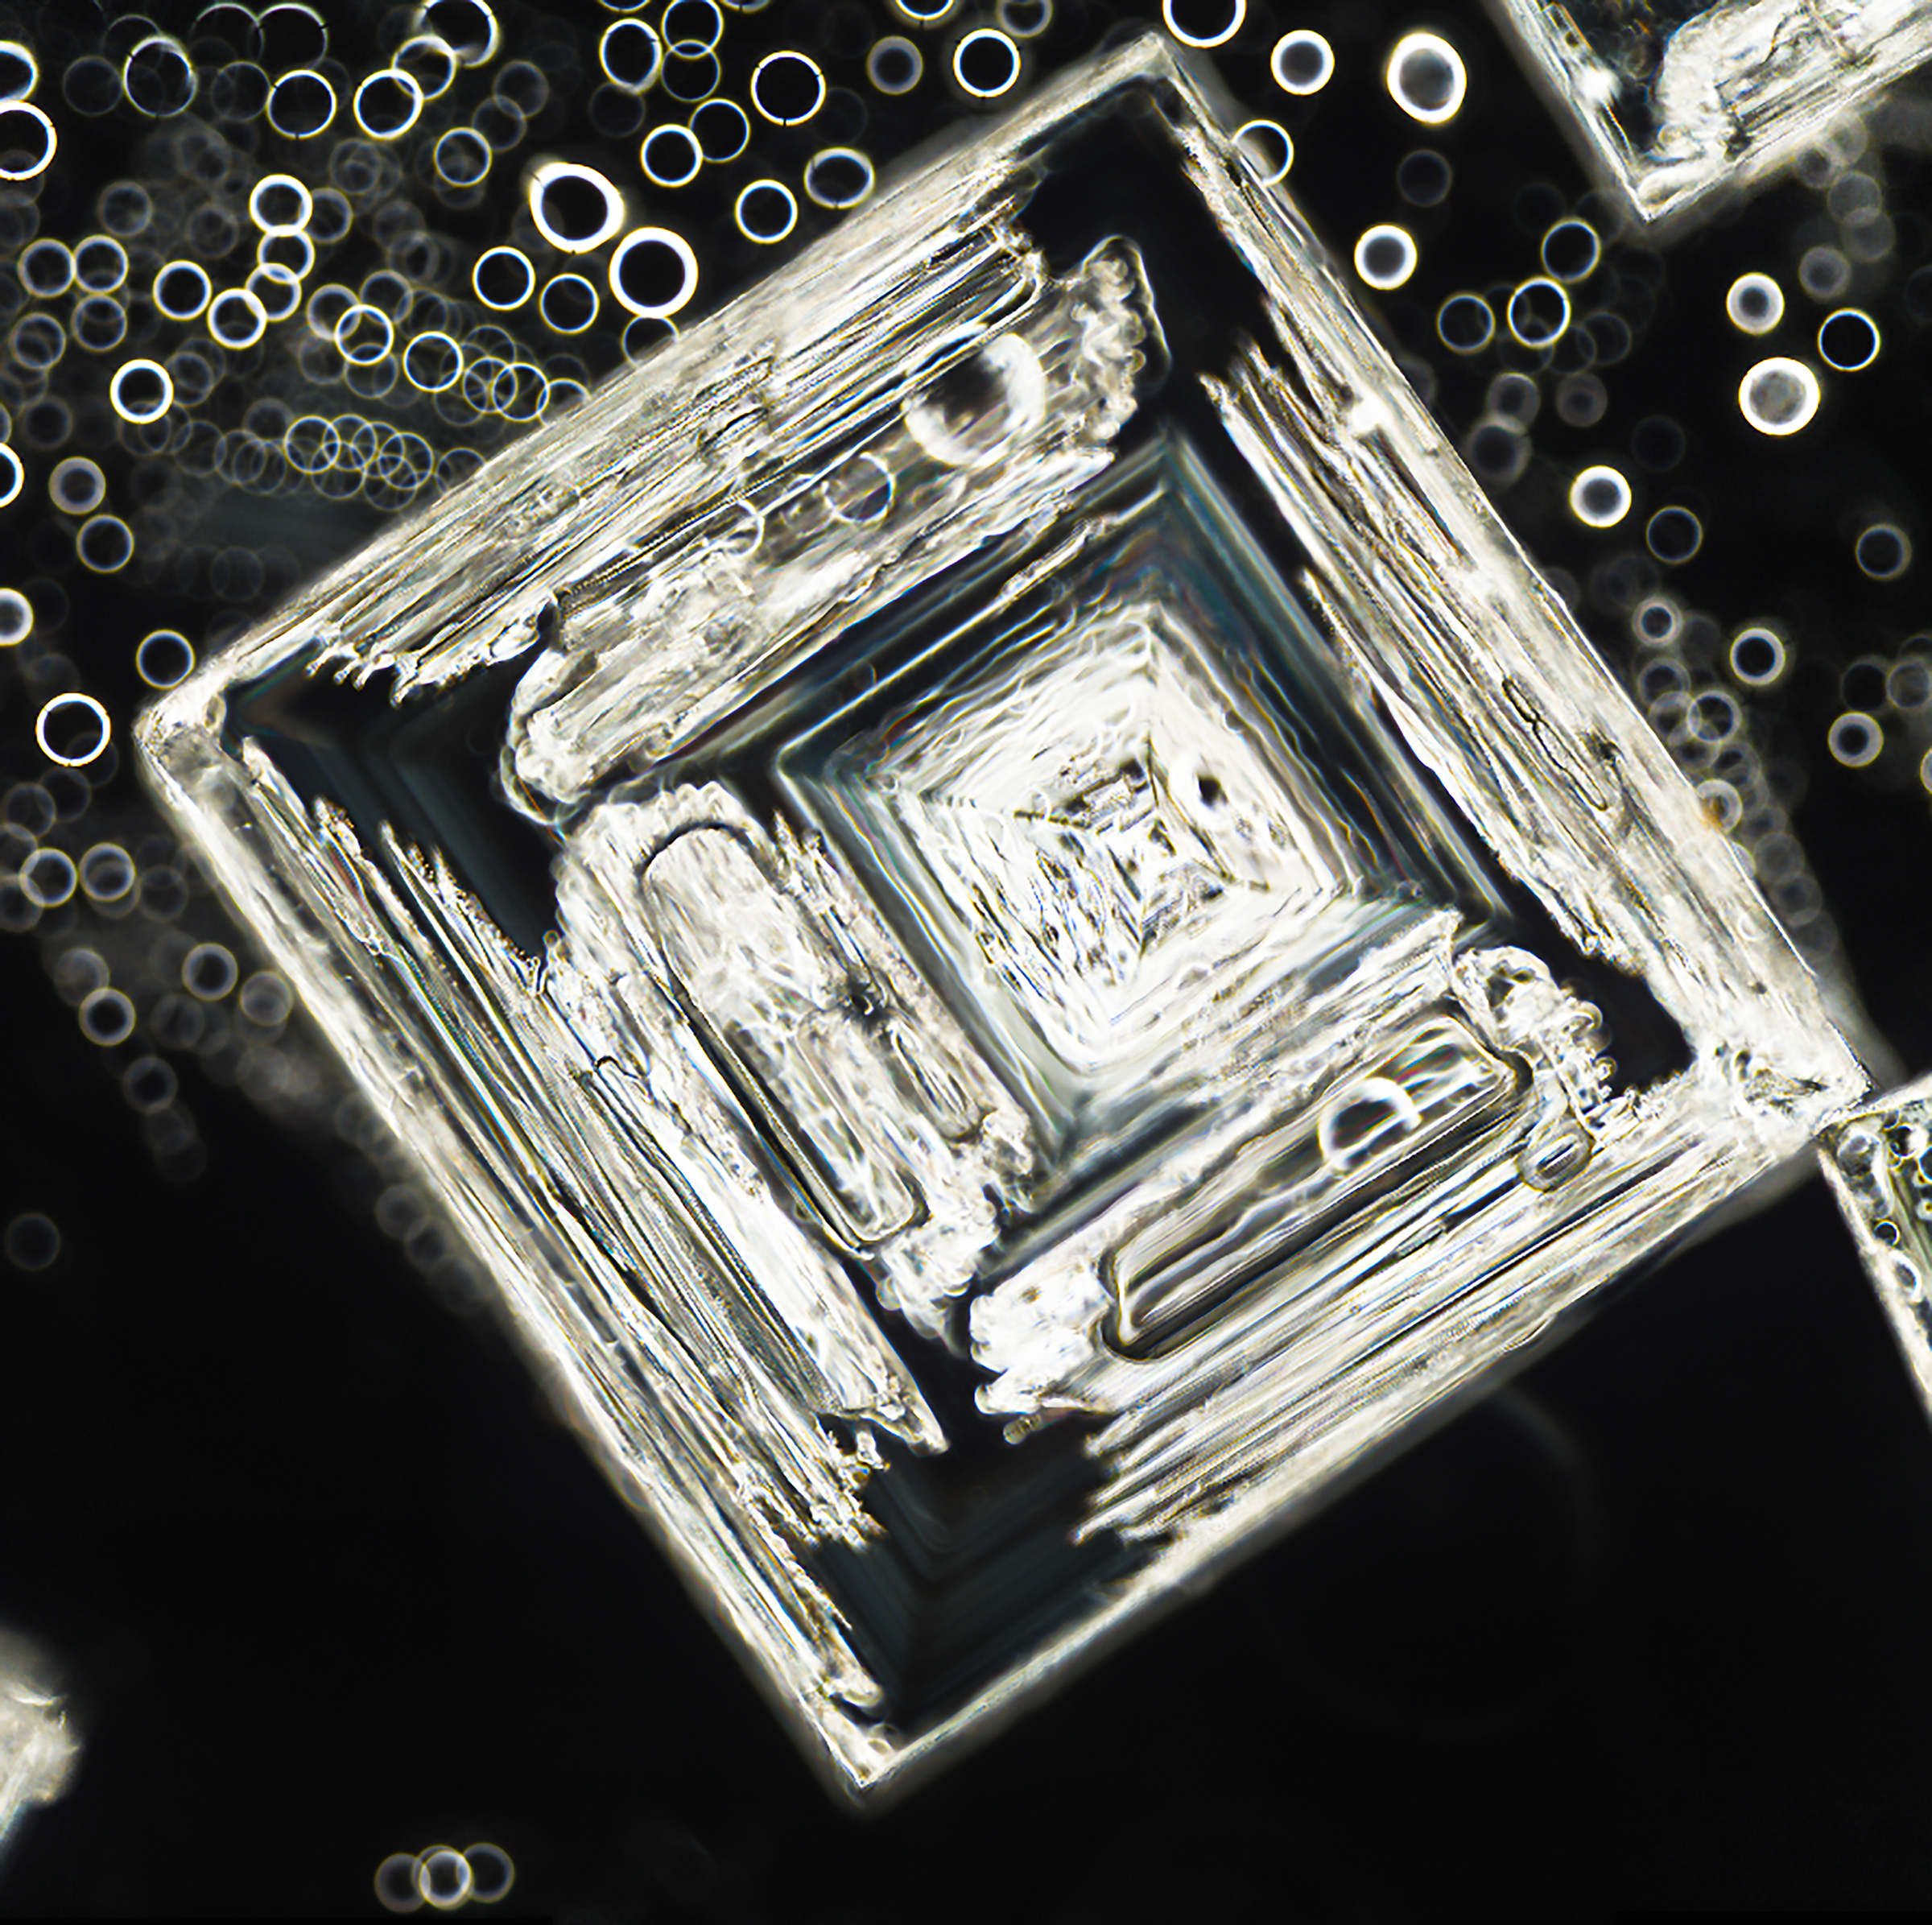
Image is buffering– Anastasiya Klebanovych
From soma to synapse, the neuronal ER is everywhere!– Cameron Paton
Drosophila melanogaster heart tube development– Rafael Perez Vicente
Type two to tango– Travis D. Carney**
Bal Masque– Travis D. Carney**
The Grasp of a Skeleton Shrimp– Caroline Hoppe
Pathways of Possibility– Julien Cicero
Crystallised B-alanine & l-Glutamine– Tian Olivier
Crystallised B-Alanine and L-Glutamine– Tian Olivier
Festivus– Travis D. Carney**
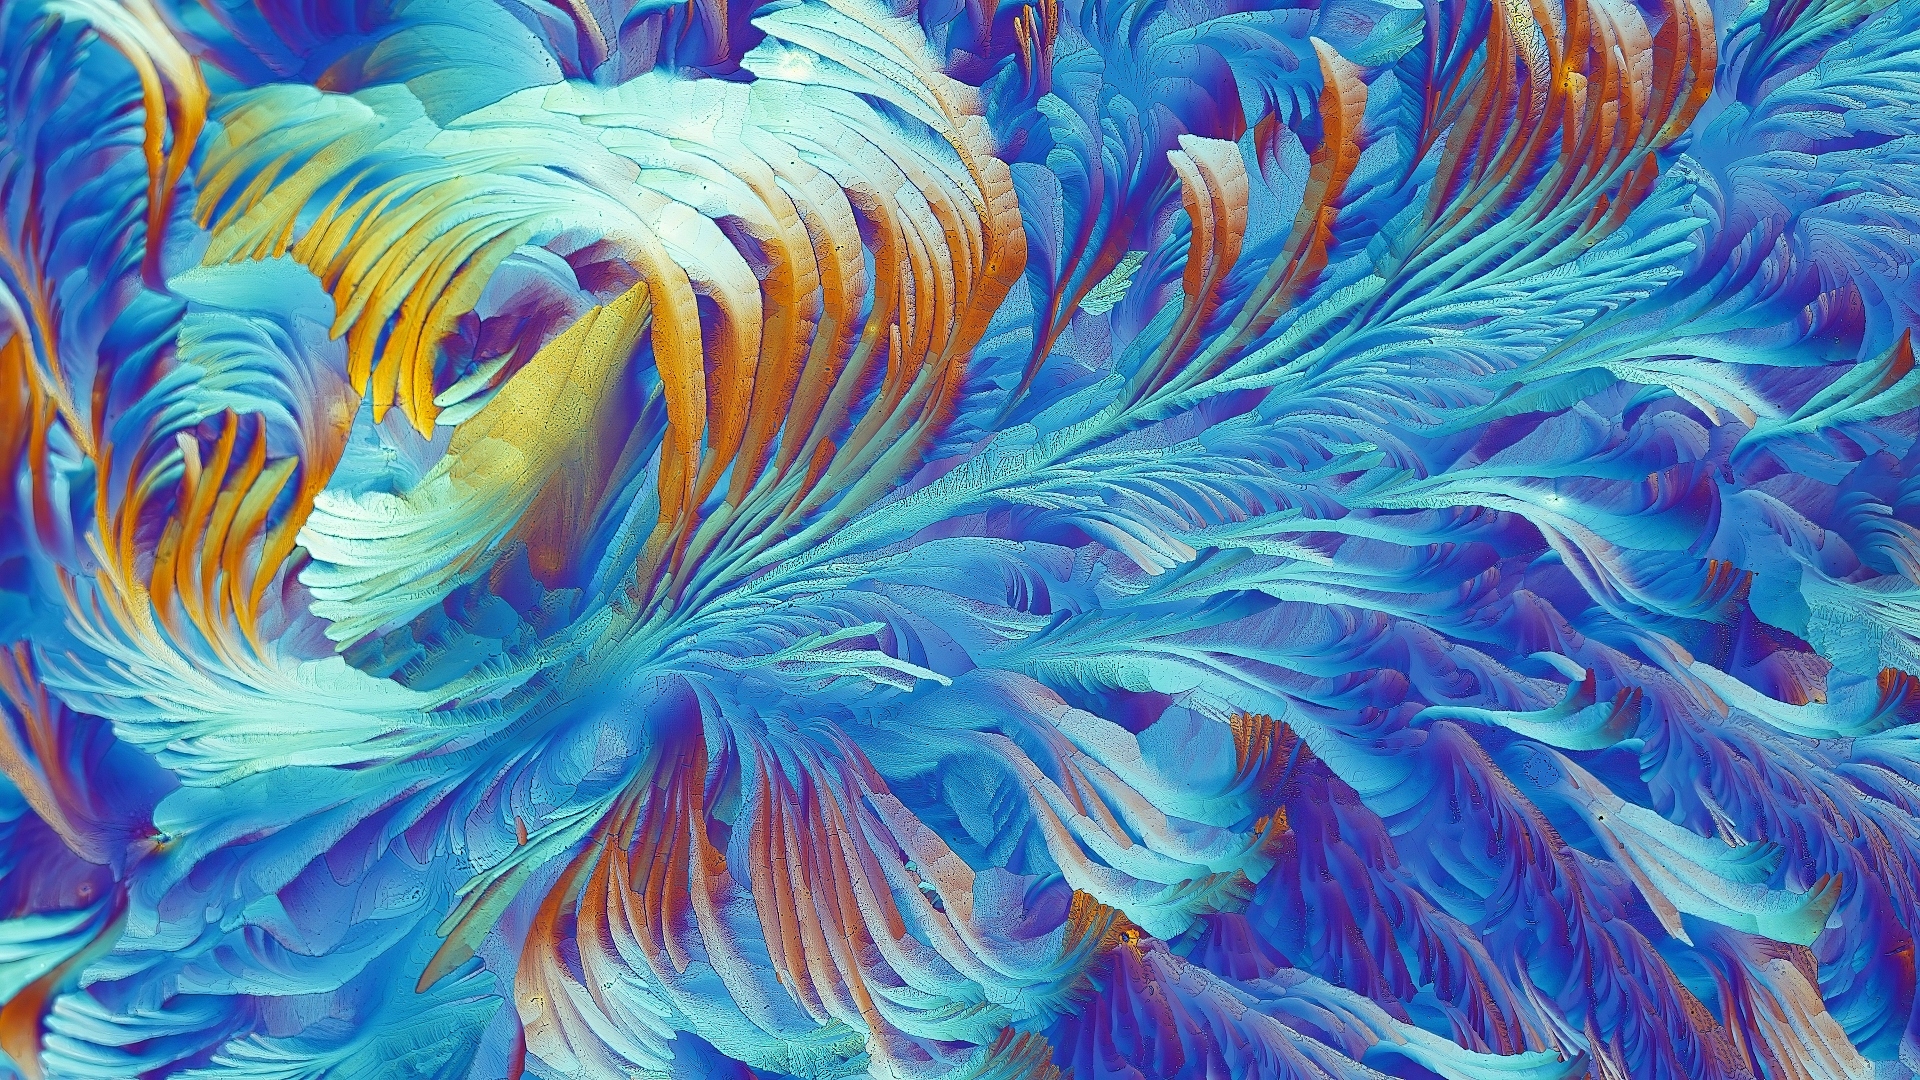
Amino Acid crystals– Tian Olivier
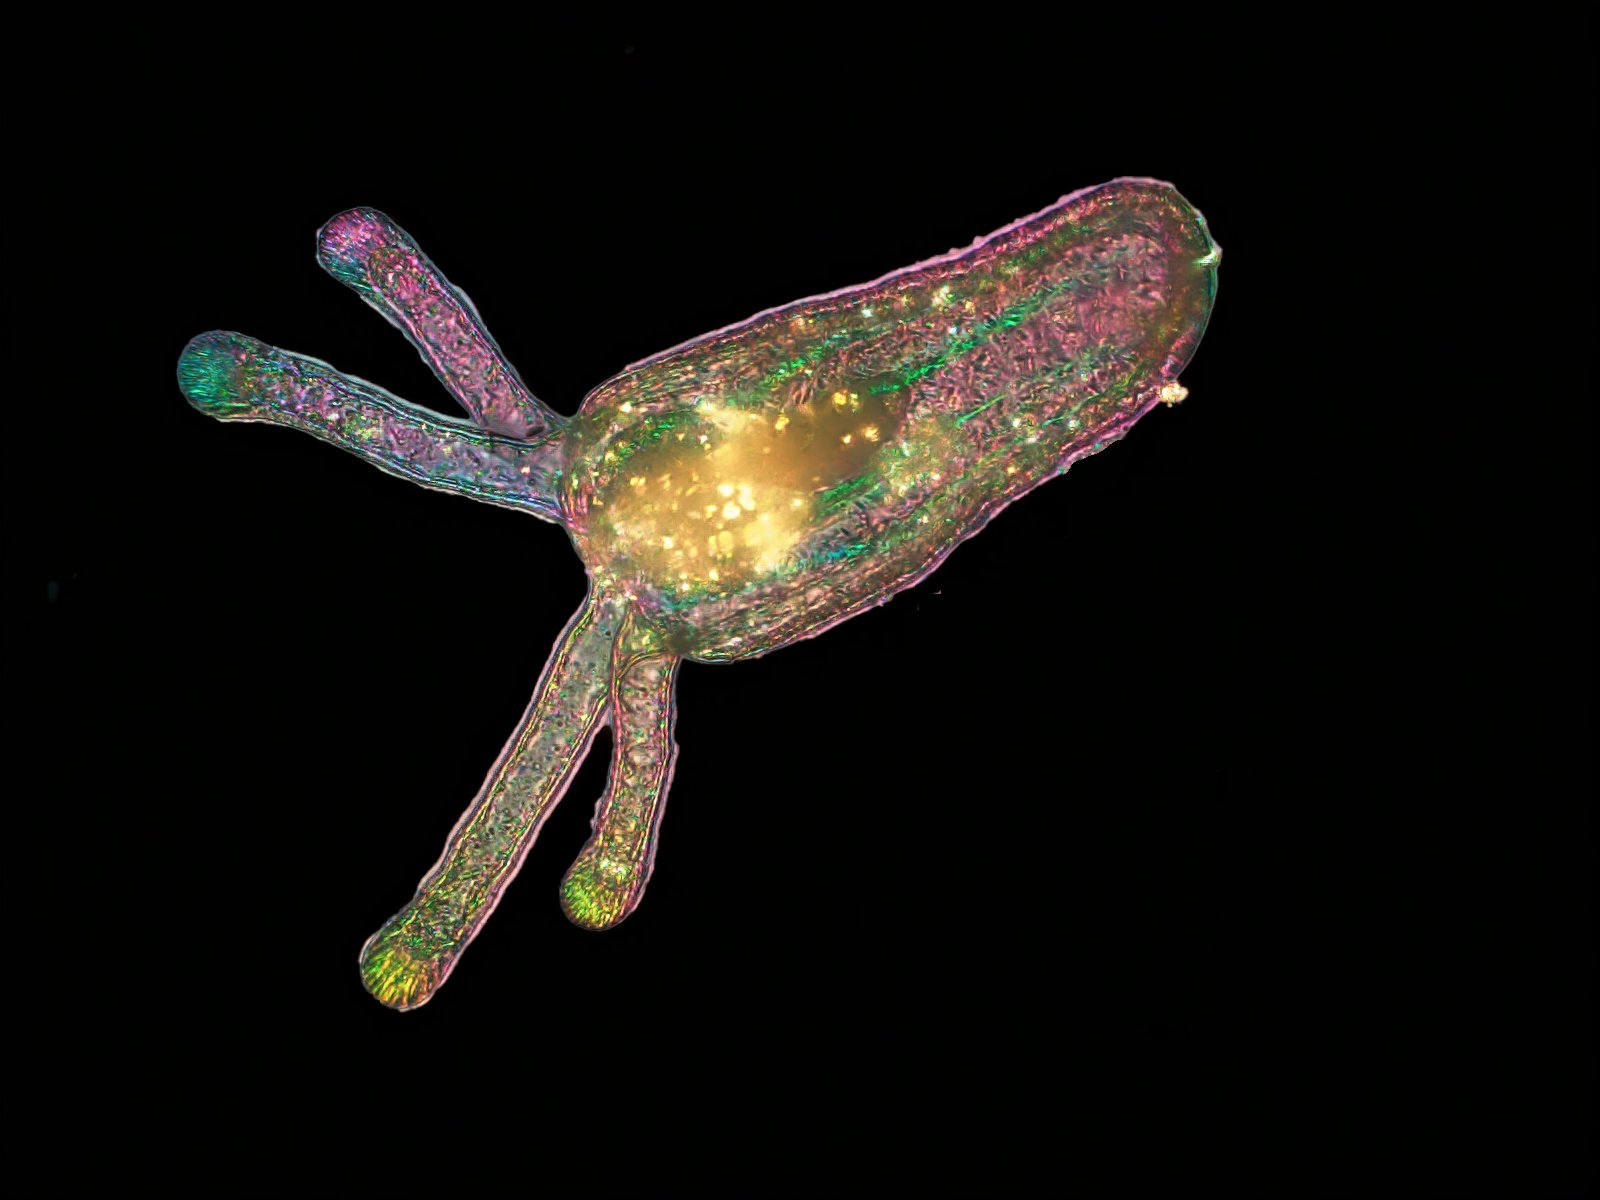
filtration ball– Caramai Kamei
tree trunk- Caramai Kamei
feelers– Caramai Kamei
two-week-old larval sea anemone, Nematostella vectensis– Michael Shribak and Karen Echeverri
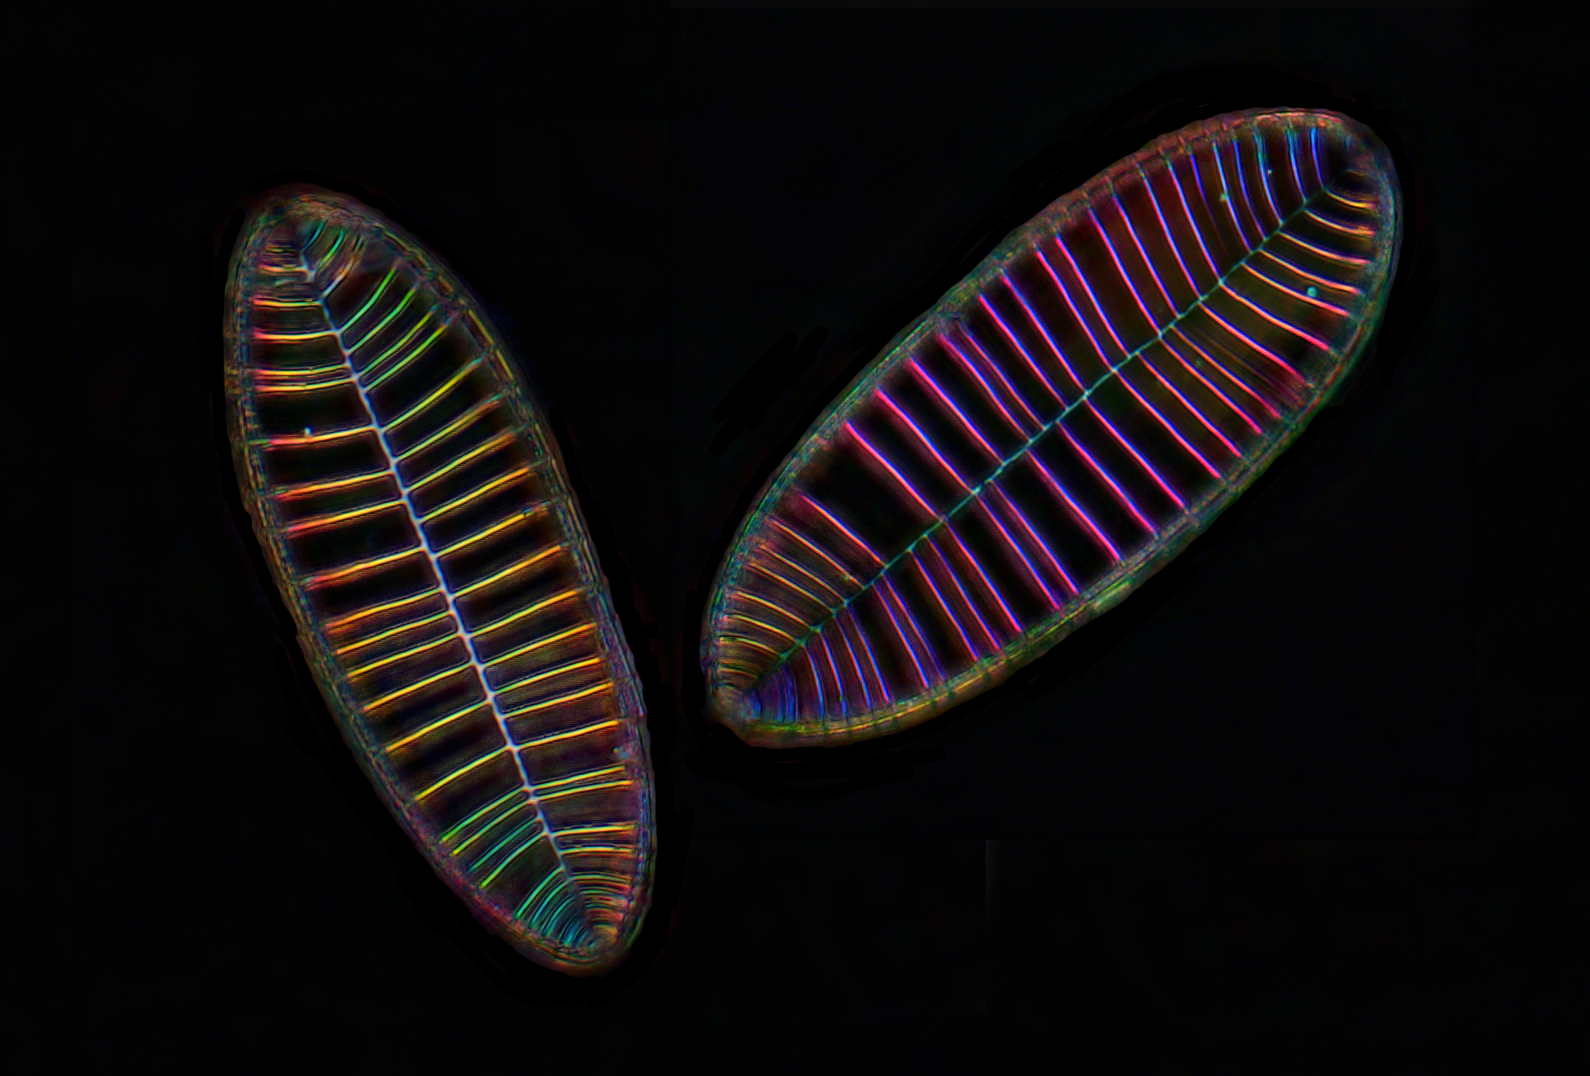
Diatom Surirella gemma- Michael Shribak
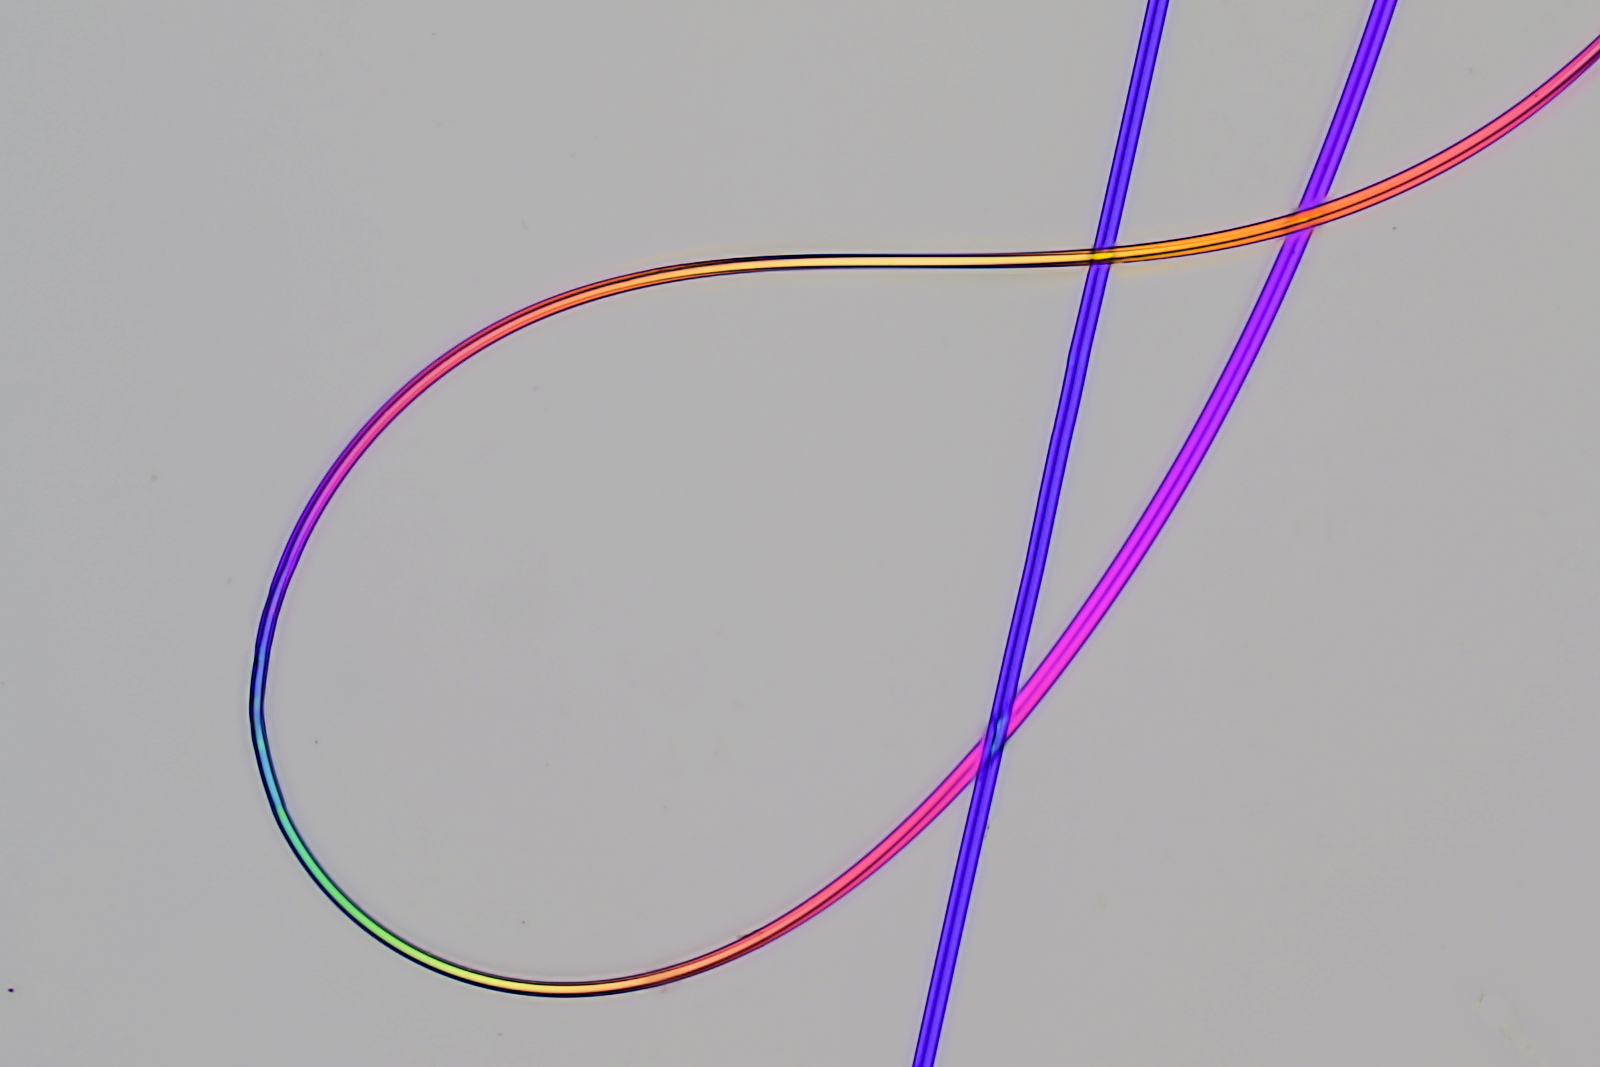
spider (Eriophora transmarina) silk – Michael Shribak
Neurons replicated…the University of Montreal logo in vitro!– Aurelie Stil
Neurons replicated…the University of Montreal logo in vitro!– Aurelie Stil
Sighting a racehorse– Team: Mariana De Niz, Jocelyn Salvador, Luisa Iruela-Arispe
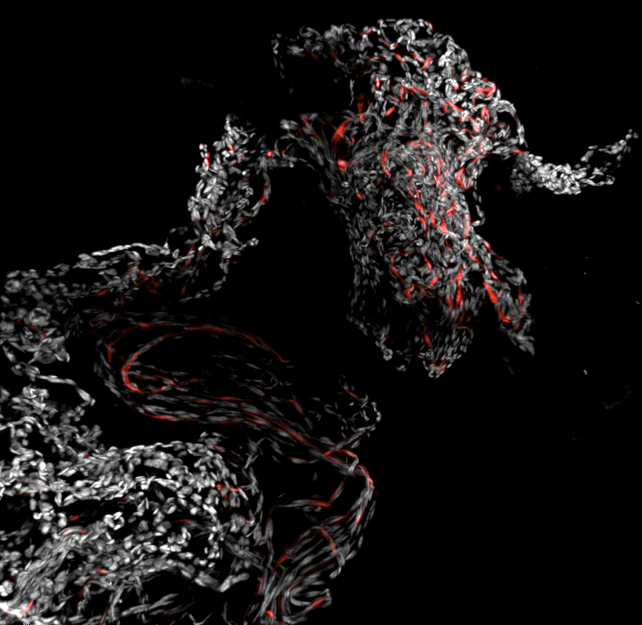
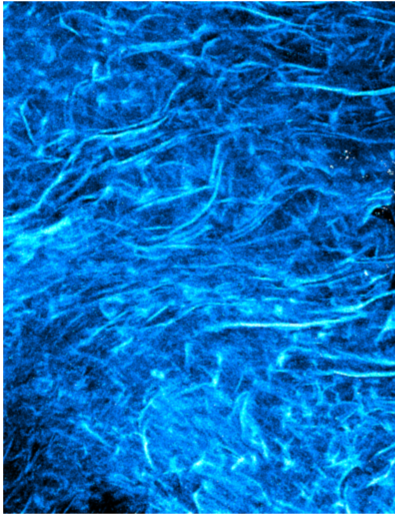
Fibrous Frontier– Jordan Miner
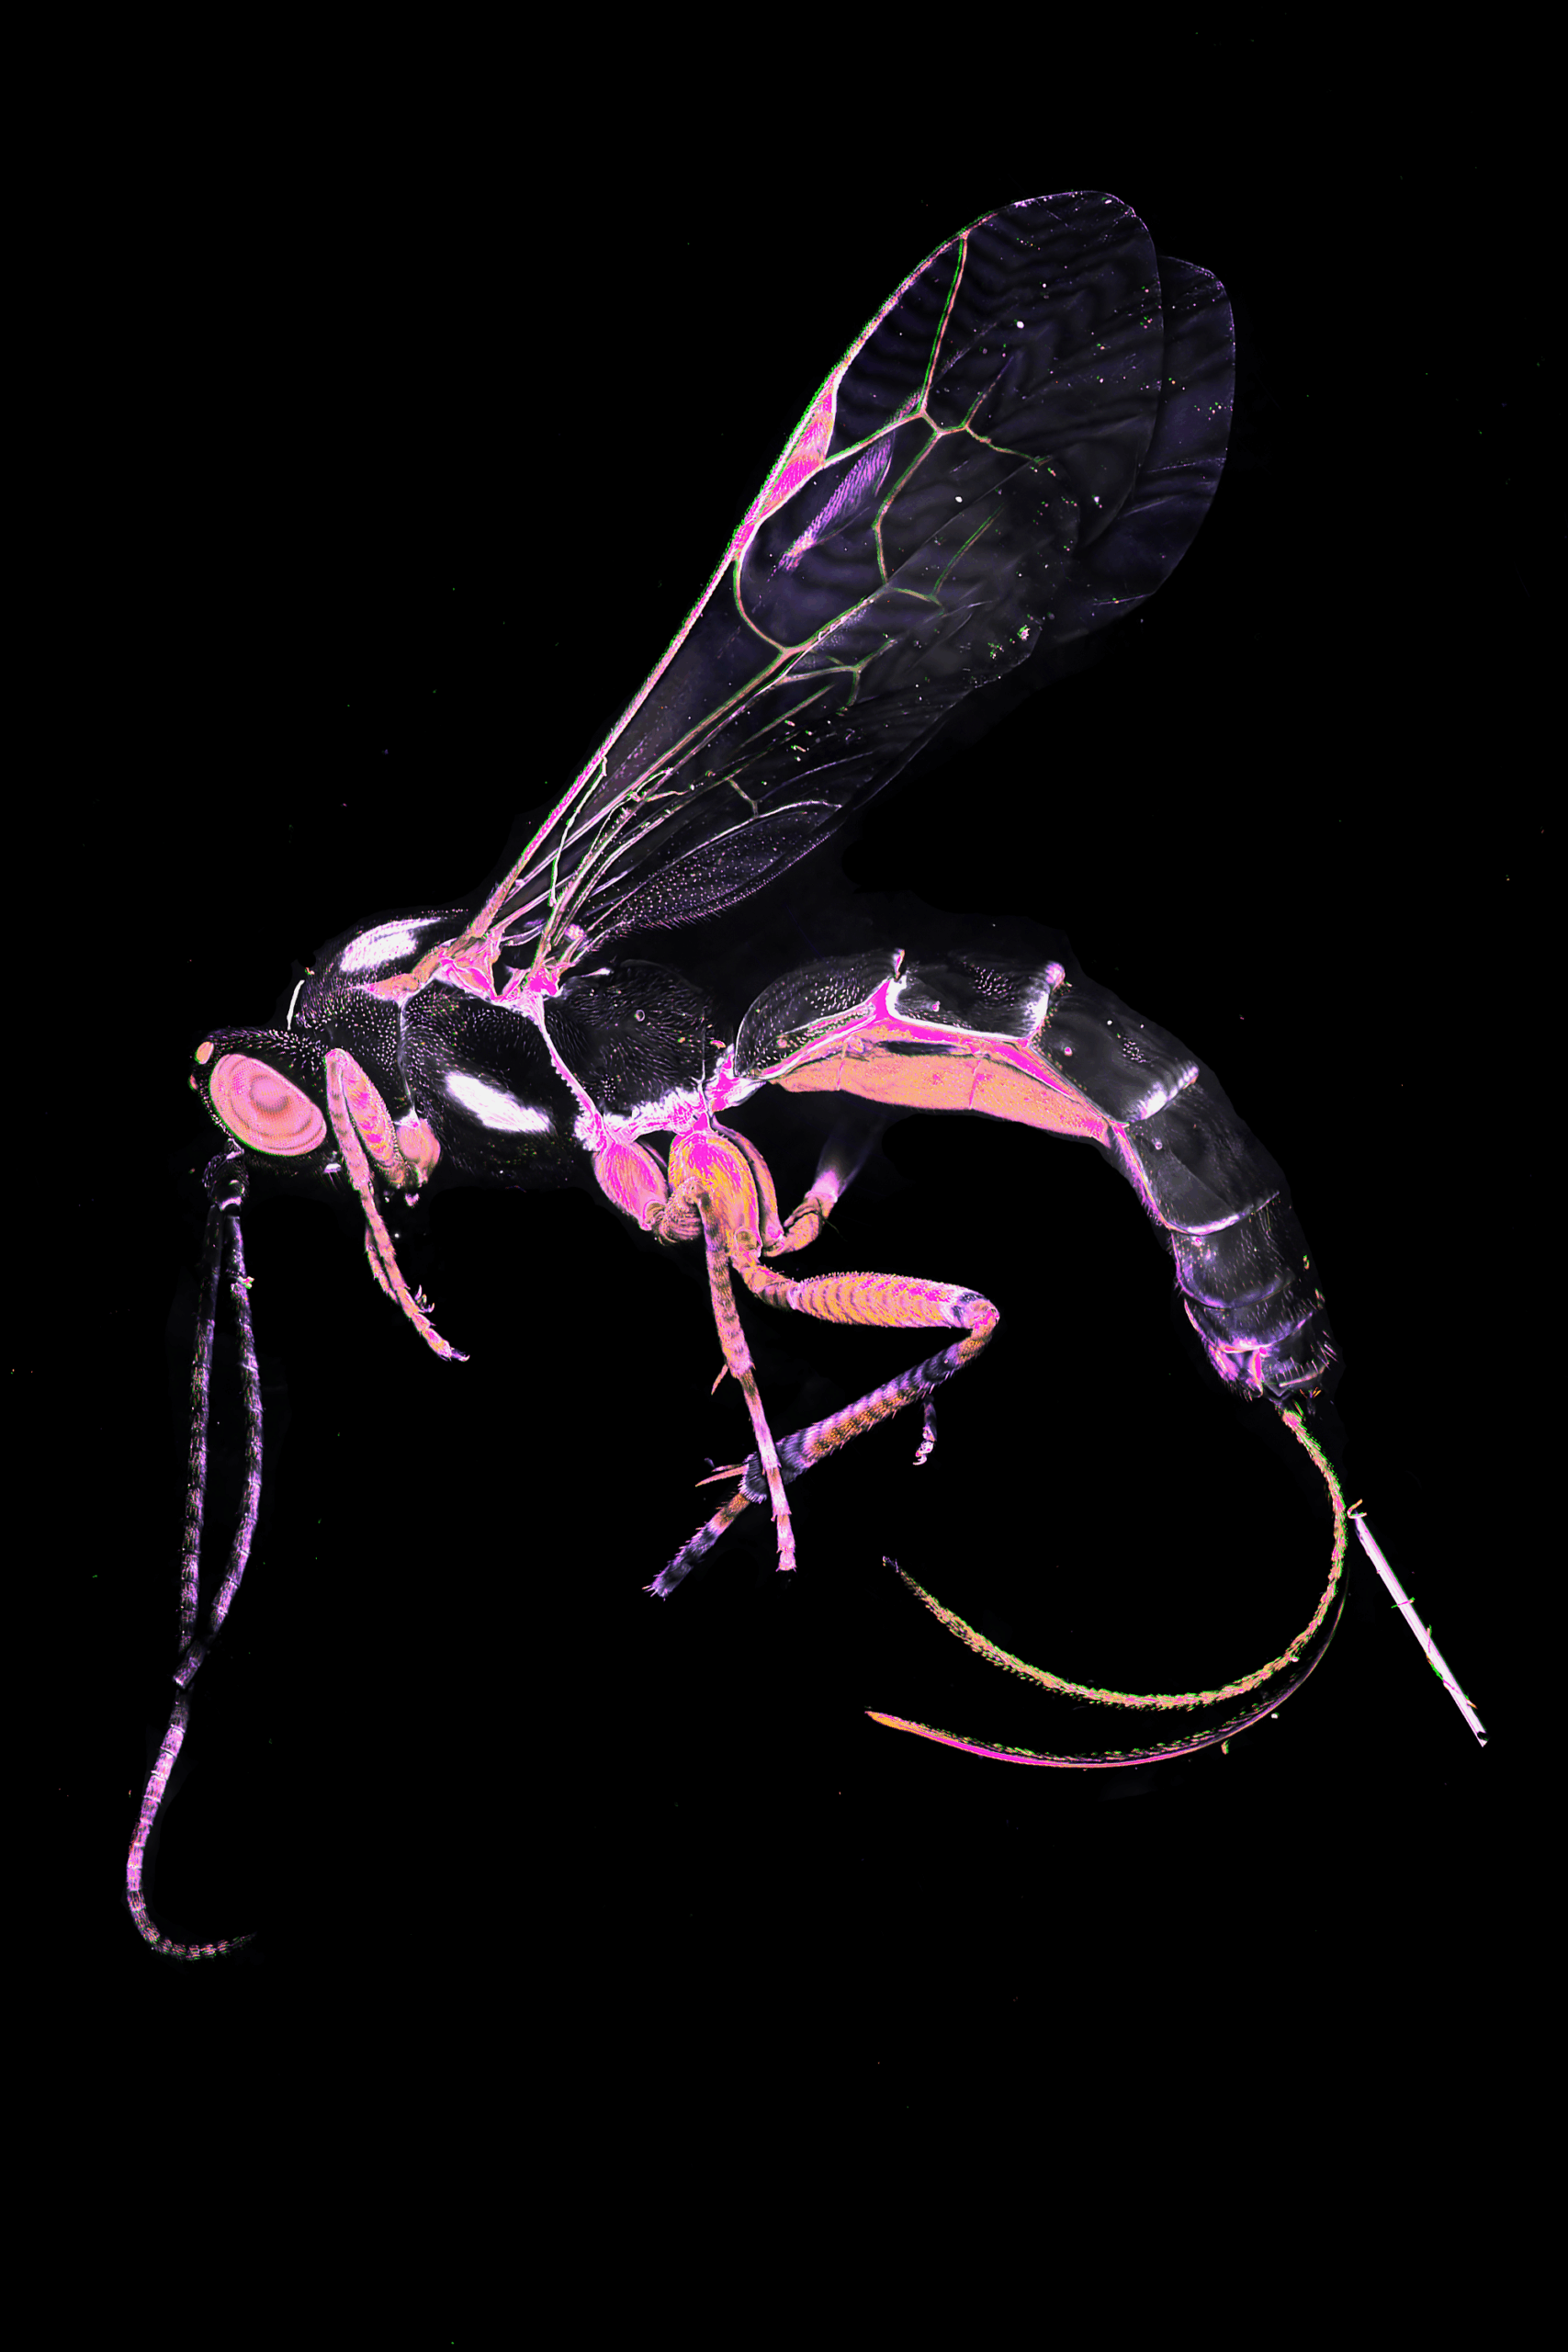
Fluorescent Flight: Parasitic Wasp in Pink Spectrum– Frederic Bonnet
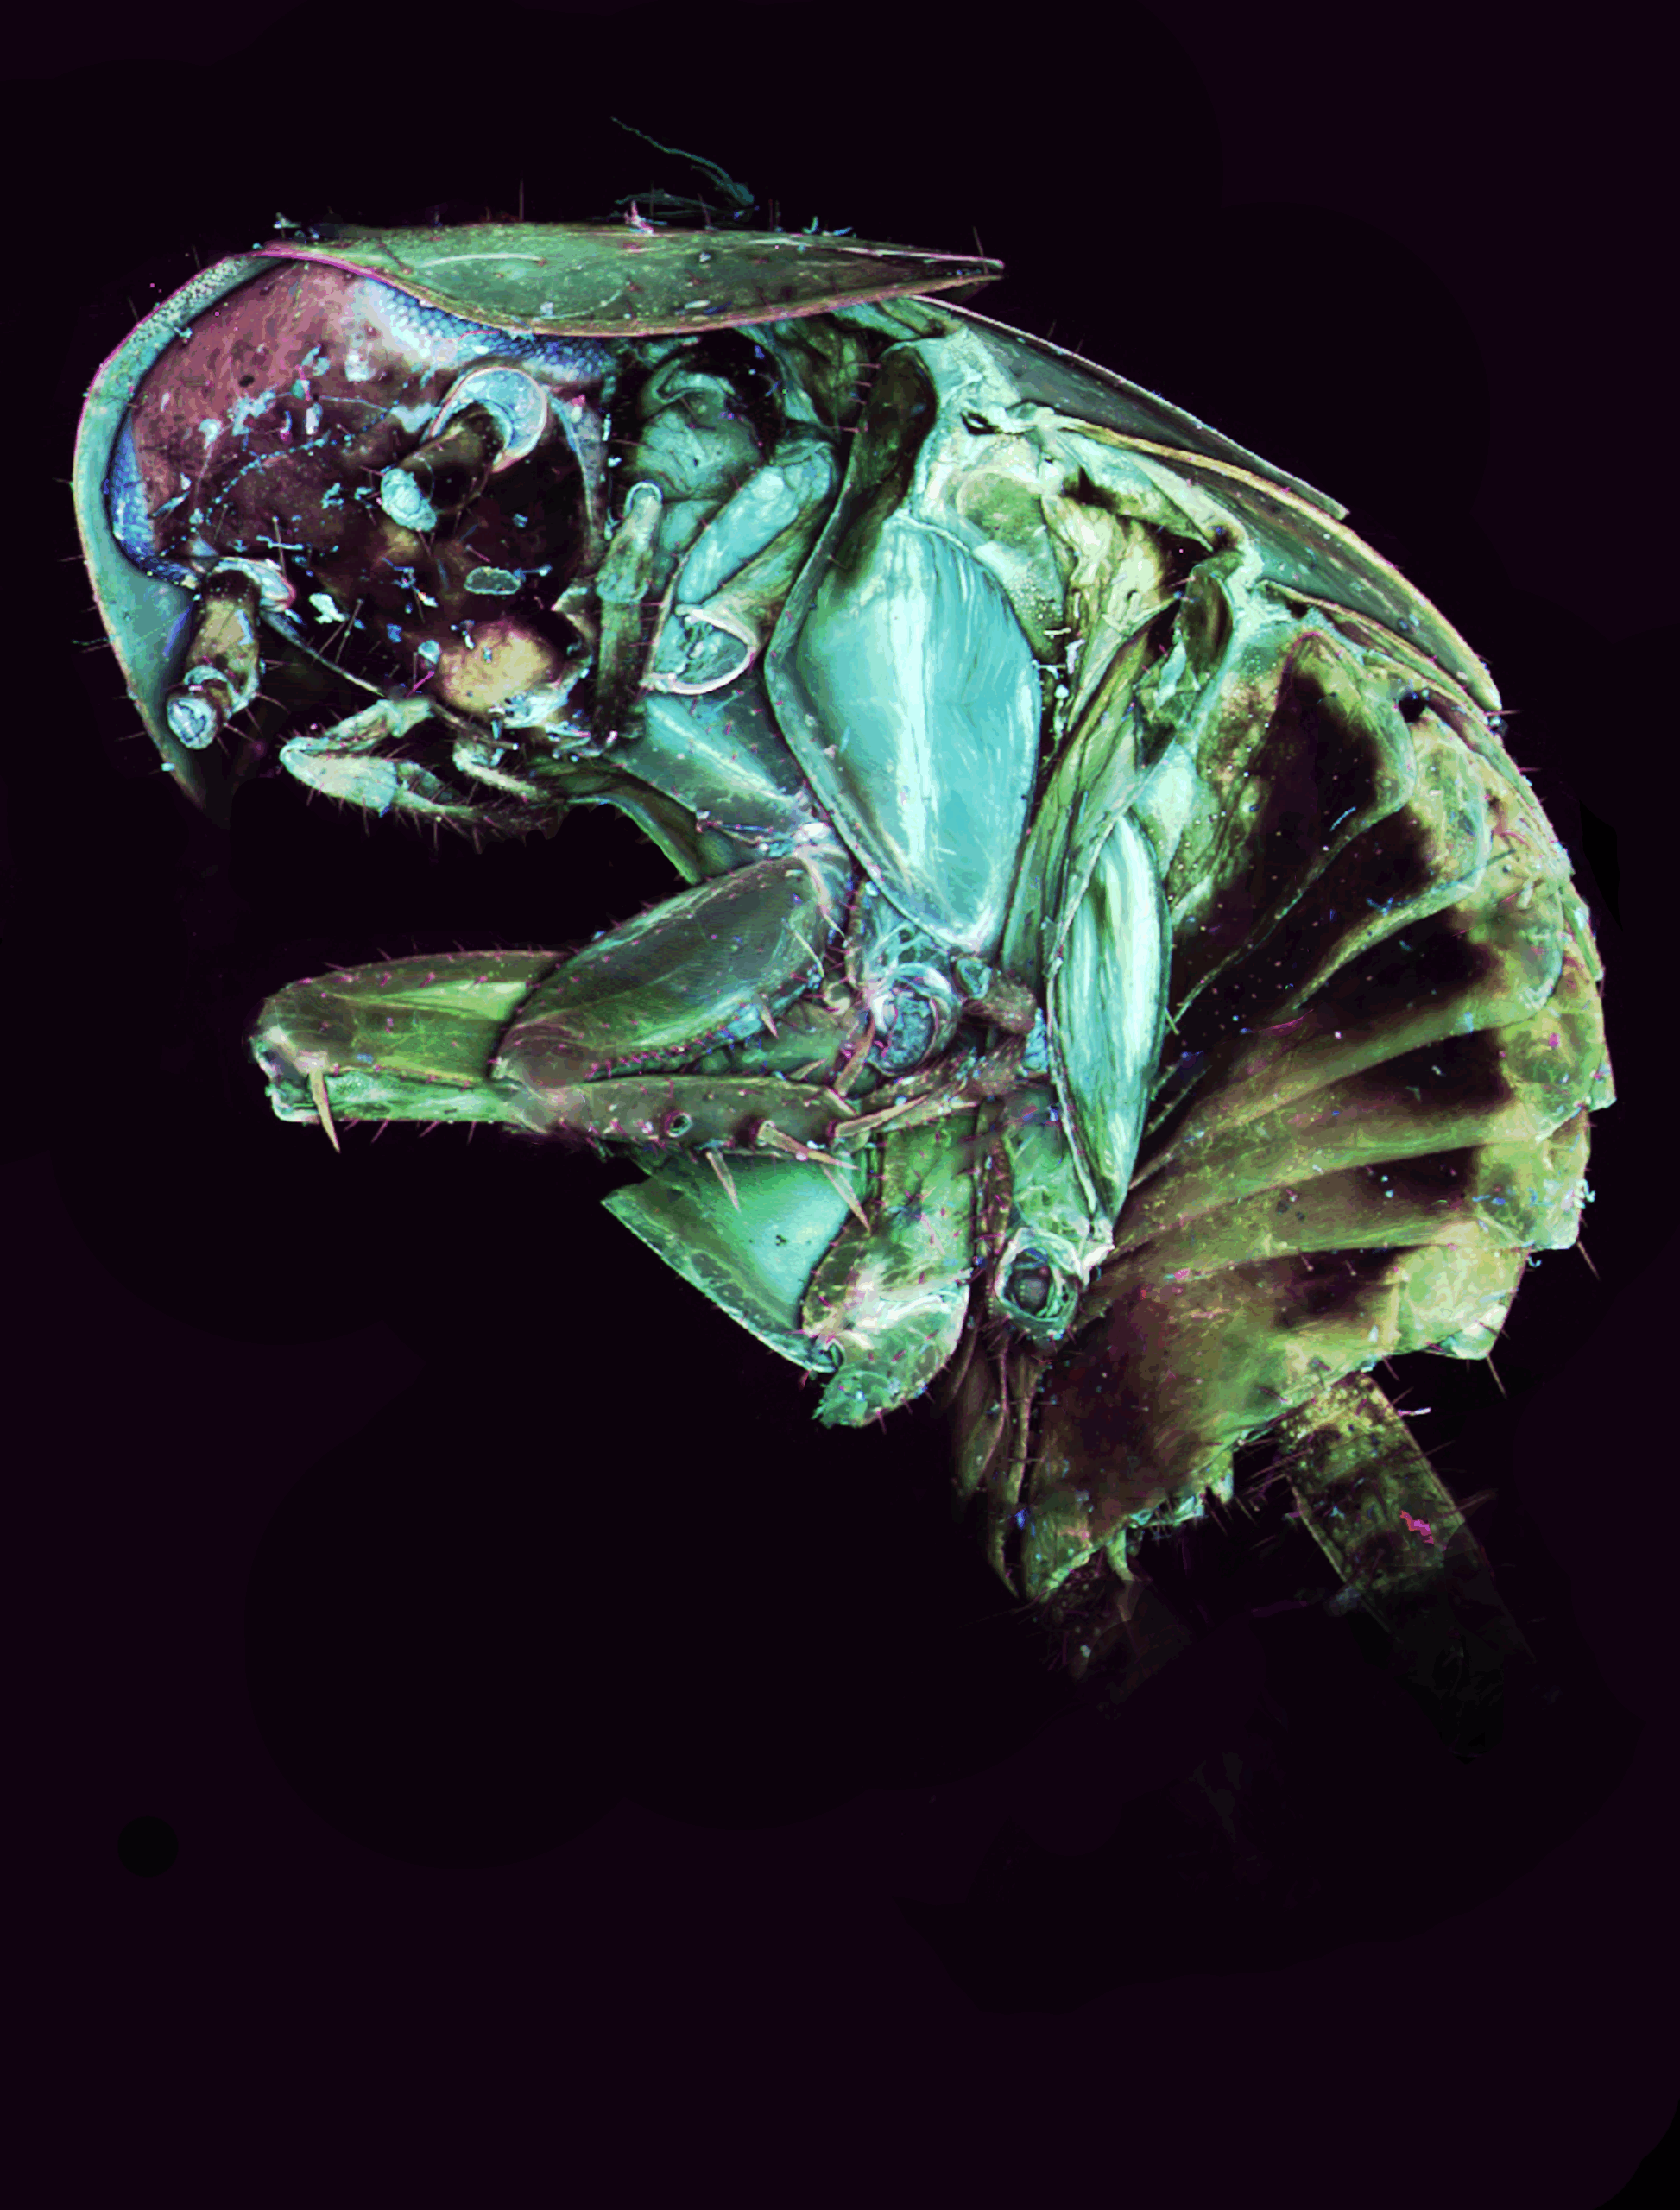
Emerald Architecture: Beetle’s Ventral Symphony– Frederic Bonnet
More than meets the eye: Actin in the zebrafish eye region- Caroline Hoppe, Valerie Tornini
Harmonic Waves– Team: Mariana De Niz, Dina Arvanitis, Jocelyn Salvador, Luisa Iruela-Arispe
The zebrafish– Romain Menard
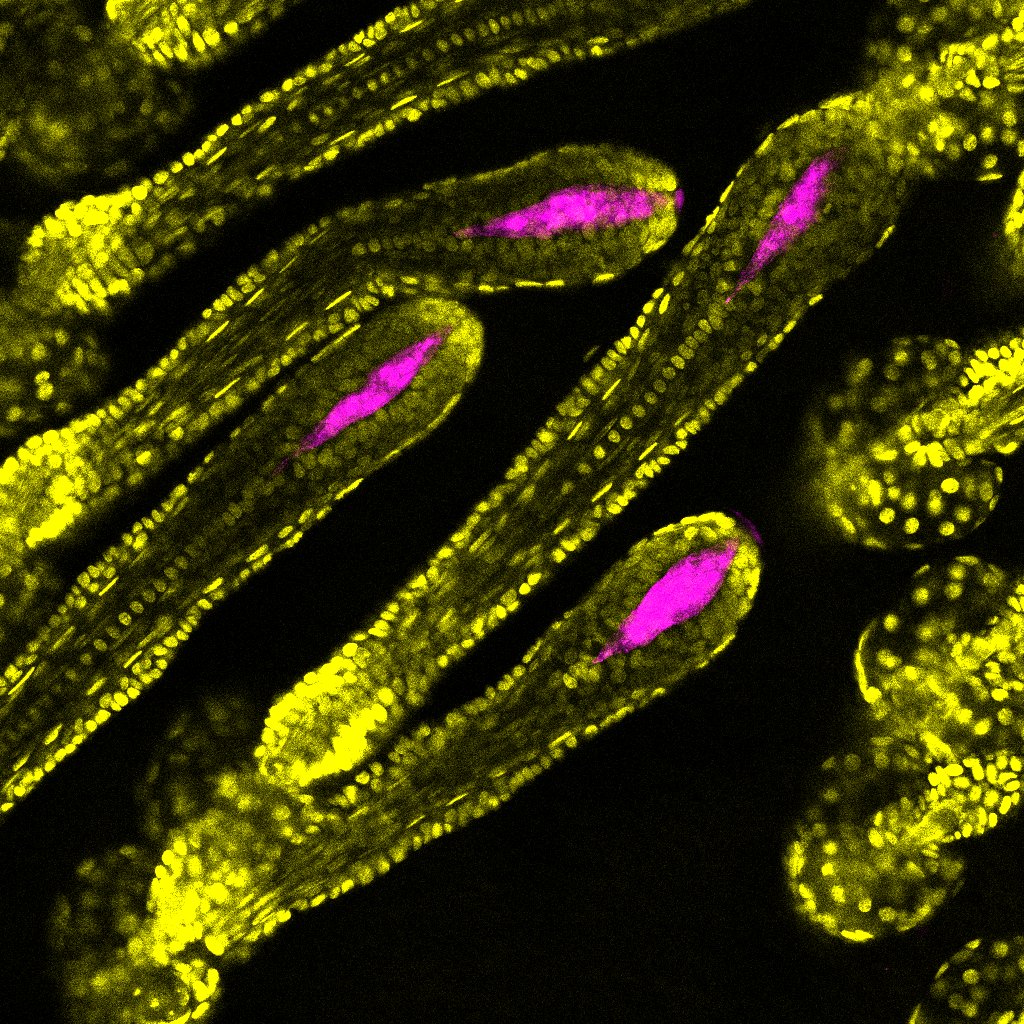
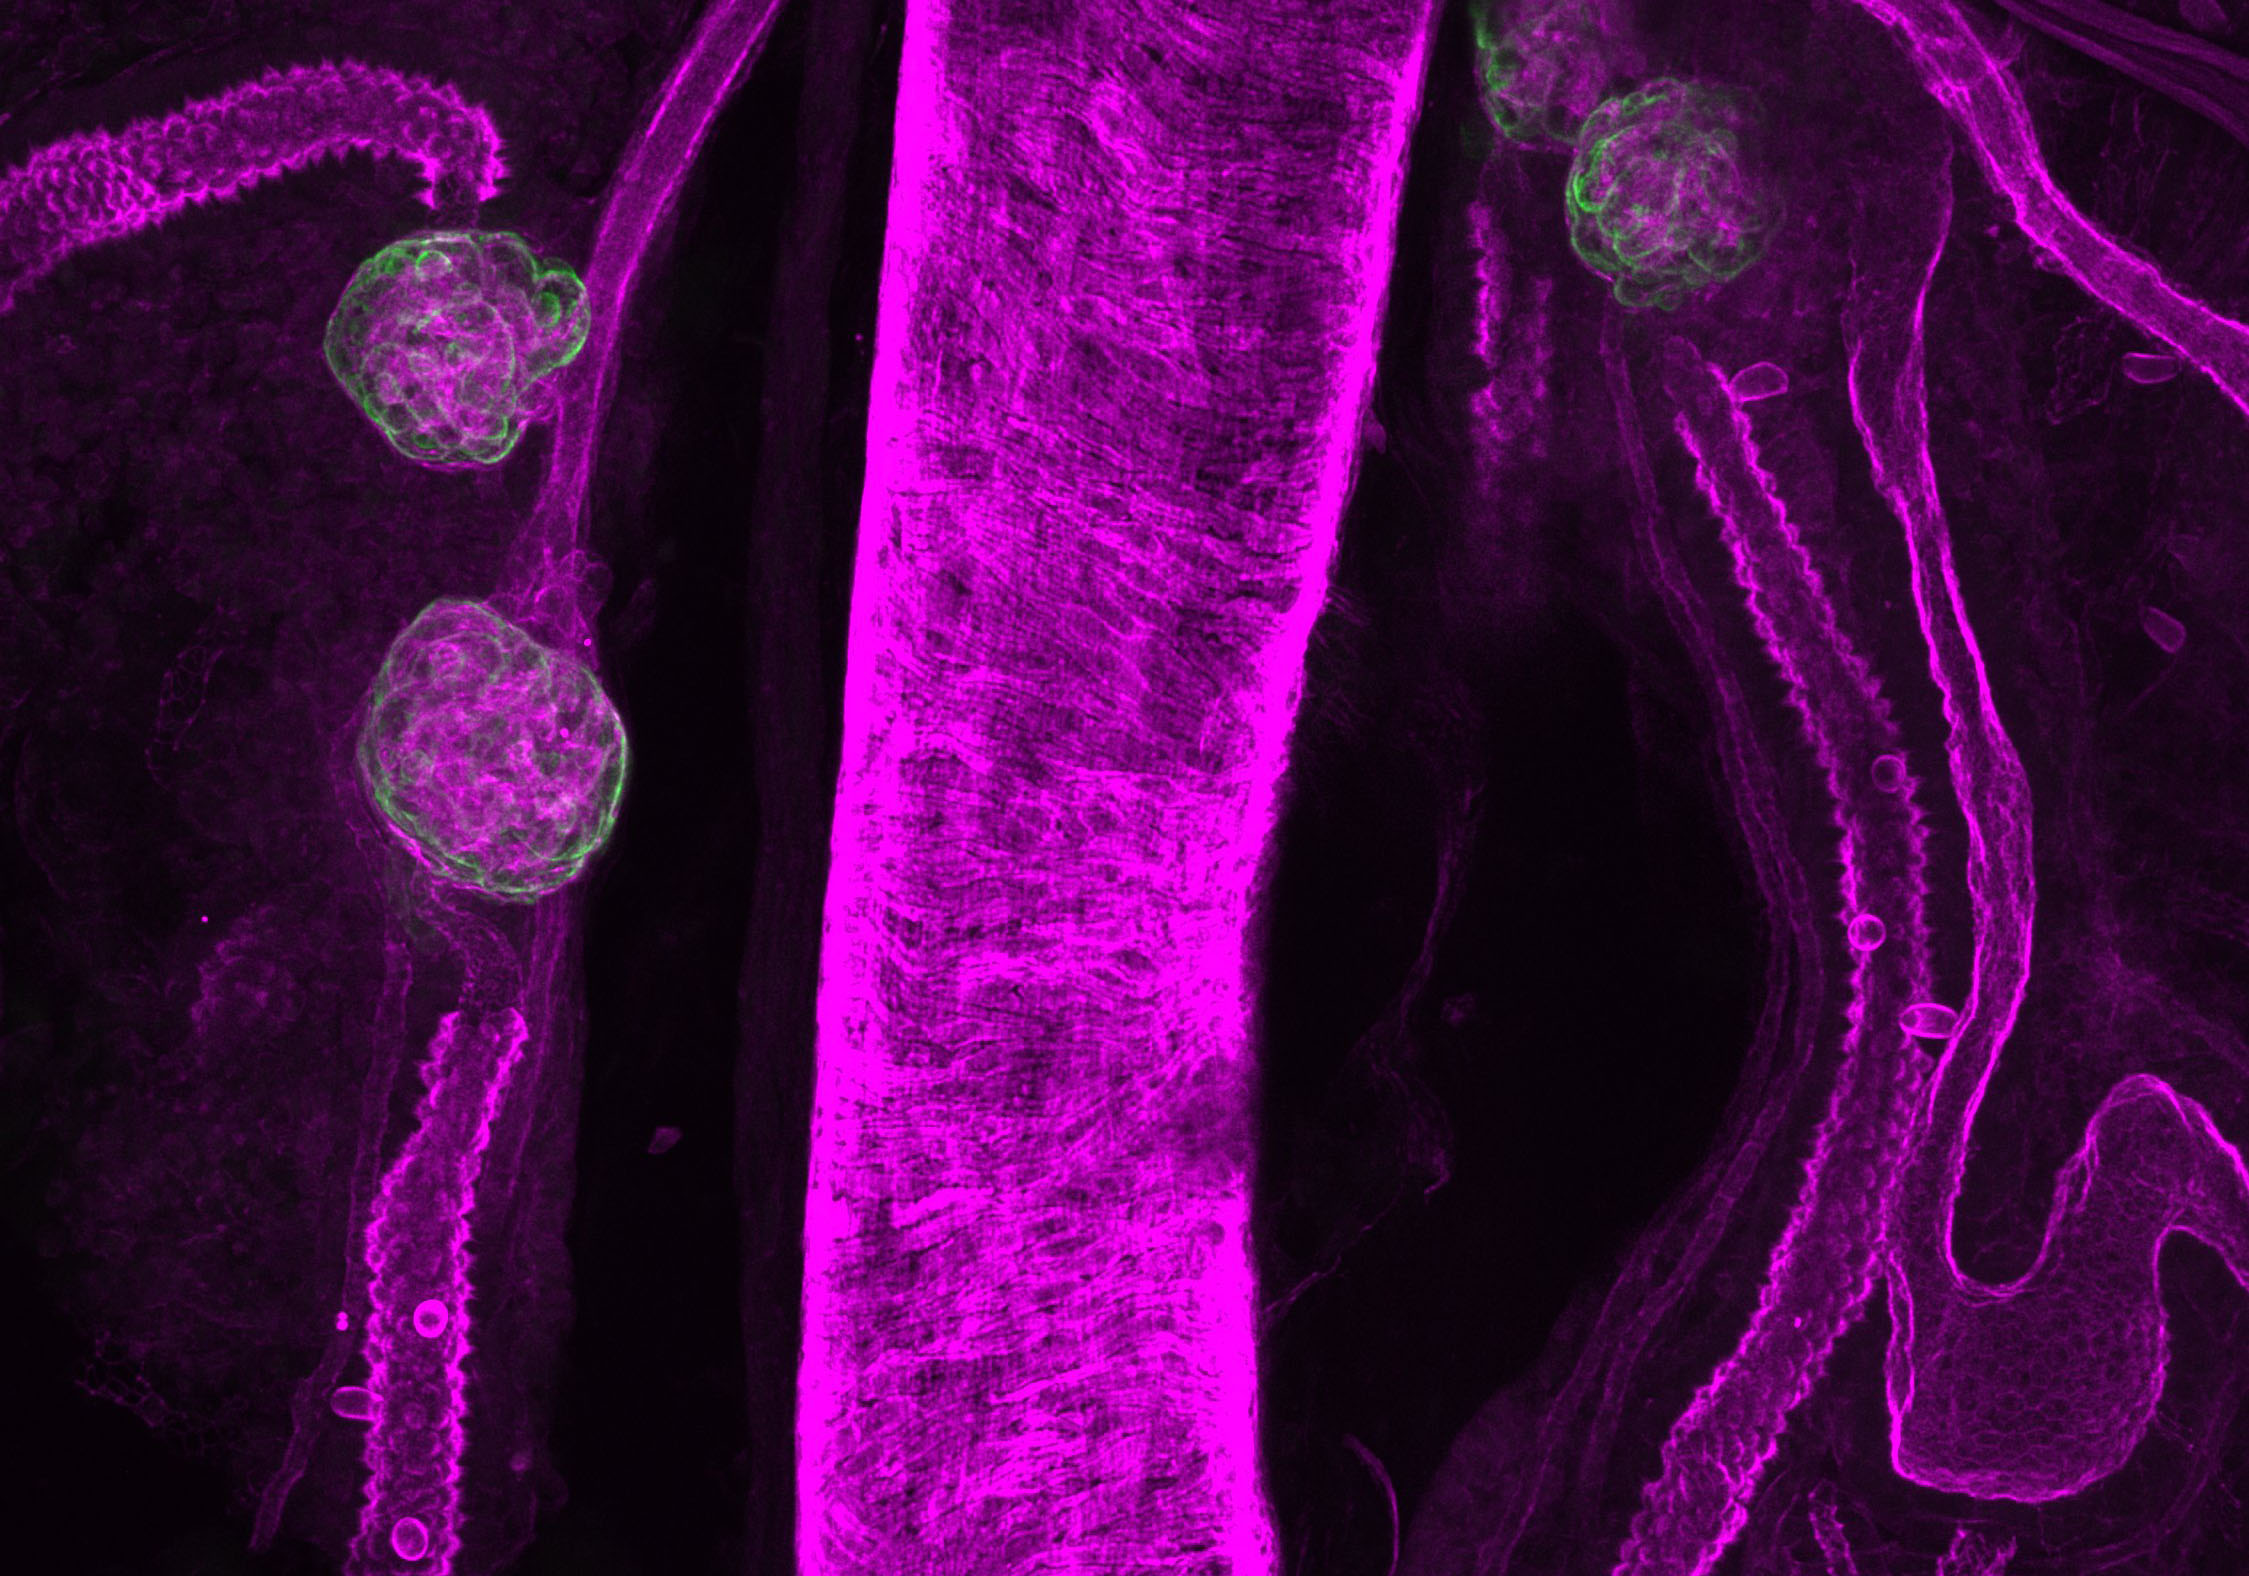
Murine Hair Follicles– Adrian Kwiatkowski
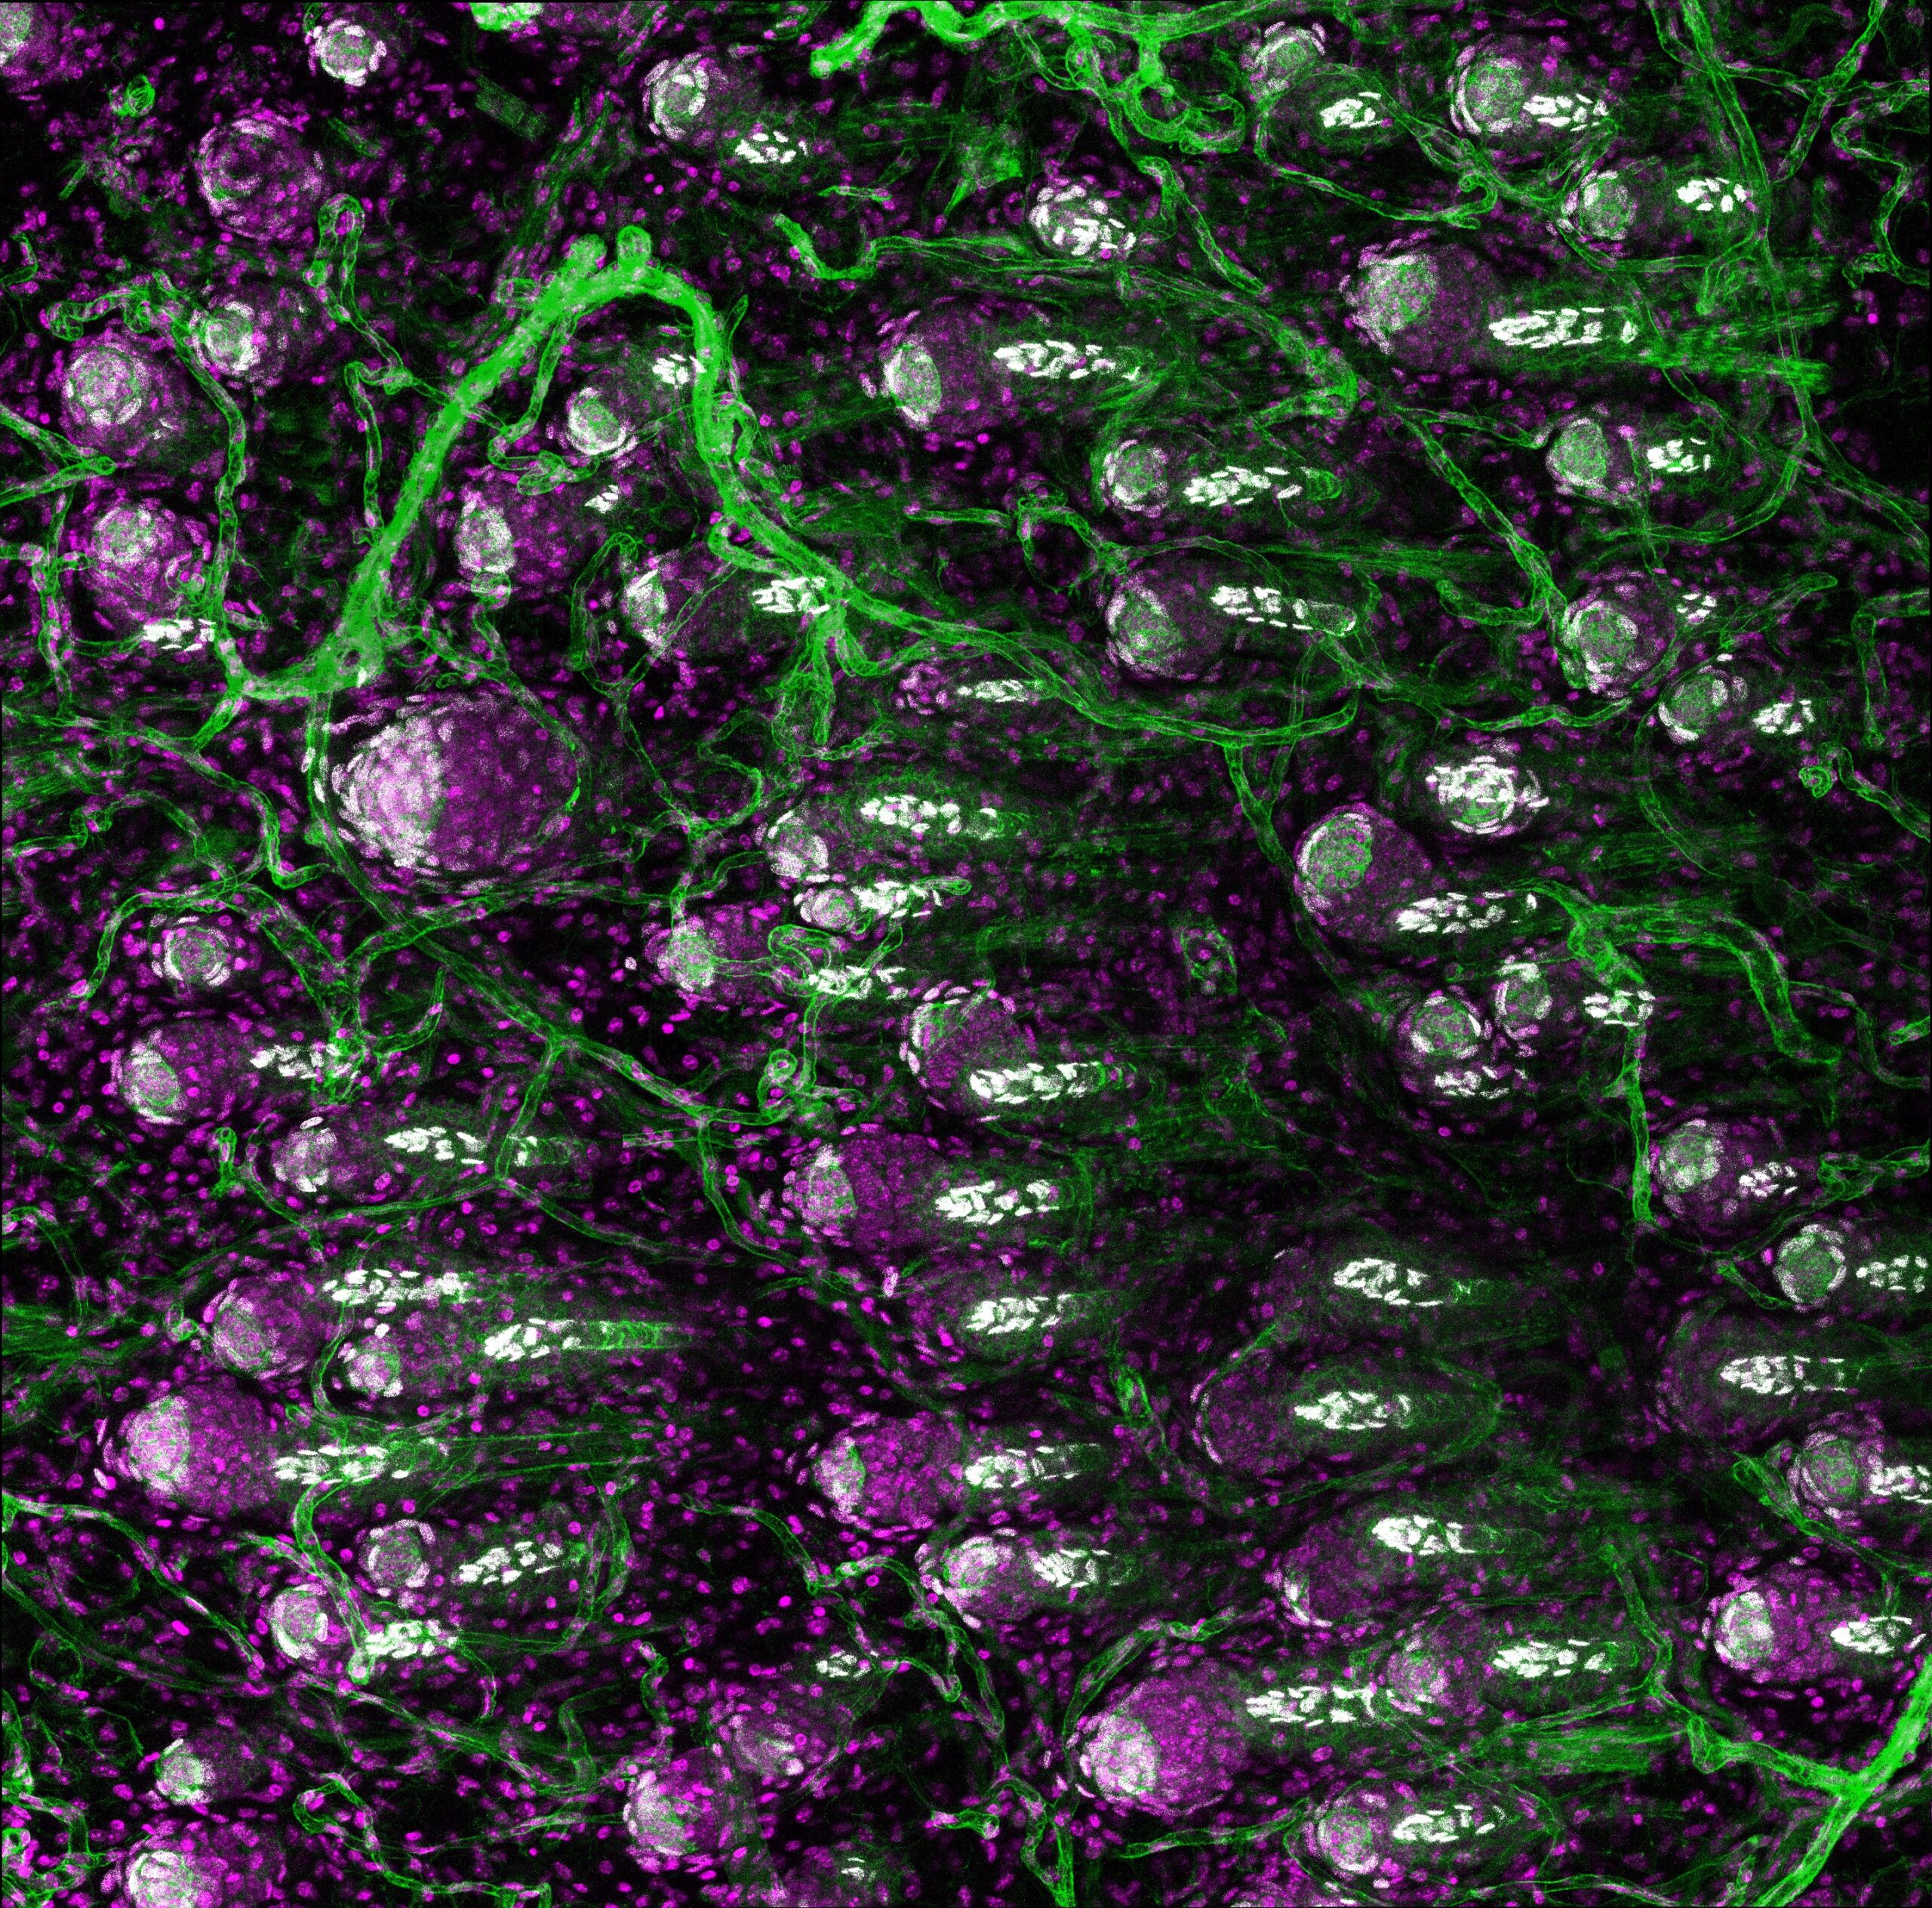
The hidden neighborhood in skin–Adrian Kwiatkowski
Regressing Hair Follicles in Murine Skin– Adrian Kwiatkowski
Where Cells Meet: The Lens Anterior Suture– Sepideh Cheheltani